Learn why investors should know about correlation matrices, and download an Excel-VBA spreadsheet to calculate this important asset allocation tool
It’s an age-old mantra, but investors need to diversify. This can never be stressed too much or too often. But what do we mean by a diverse portfolio?
Well, a diverse portfolio contains uncorrelated assets – in other words, assets that don’t go up and down in tandem. After all, if one stock falls, you don’t want your other investments to drop like a stone as well.
How do financial analysts describe the strength of this relationship?
They use a tool called the correlation coefficient (also called the Pearson product-moment correlation coefficient). The correlation coefficient between two assets is a single number between -1 and 1. A value of
- 1 means that if one asset increases in value, the other increases in tandem
- 0 means that the two assets are perfectly decoupled – there’s no relationship between the price movement of either asset
- – 1 means that if one asset increases in value, the other decreases in lock-step
Let’s say you have several stocks or investments. A single number for the correlation wouldn’t be sufficient. You need a matrix of values!
The correlation matrix is a fundamental tool for stock market investors. It describes how closely the returns of the assets in a portfolio are correlated.
Quite simply, the correlation matrix tells you how well diversified your portfolio is. It is a critical asset allocation tool, and is closely related to the covariance matrix (typically employed in mean-variance optimization).
Investors are usually advised that
- a diversified portfolio will have assets with a large spread of correlations (i.e. ranging from -1 to +1). This will include bonds, precious metals, commodities and large/medium/small cap stocks.
- for their chosen assets, the correlation matrix should not tend to one during periods of historical market volatility.
An example of two assets with low correlations are the Dow Index and Merk Healthcare, with a coefficient of around 0.2 (at the time of writing).
However, Gold and the USD/EUR exchange rate are negatively correlated. When one falls, the other rises in almost perfect lock-step, giving a coefficient of nearly -1.
From 1965 to 1995, gold and oil had a high positive correlation coefficient of 0.88. However, the short-term correlation is rather more volatile – the value from 1995 to 2000 drops to -0.13
The correlation matrix of a series of N stock returns is given by
![]()
where i = 1..N and j = 1..N, and corr() is the correlation between assets i and j.
Disadvantages of the Correlation Coefficient
Financial analysts often disagree how stock correlation should be measured. Specifically, the Pearson product-moment correlation coefficient has several dissadvantages
- The approach is only valid for linear dependencies; straight-line relationships between two assets are not often observed. Other are often used to describe non-linear stock correlation, including recurrence quantification analysis and power spectrum analysis.
- The approach only captures the first two moments of the relationship. This means a value of 0 does not necessarily indicate a relationship does not exist.
- Correlation changes over time – a value (or table of values) is simple a snapshot in time. For example, gold-oil have a high long-term correlation, but the relationship is volatile over shorter time windows.
Calculate the Correlation Matrix in Excel
This Excel spreadsheet contains a VBA function to calculate the matrix. The spreadsheet is simple to use.
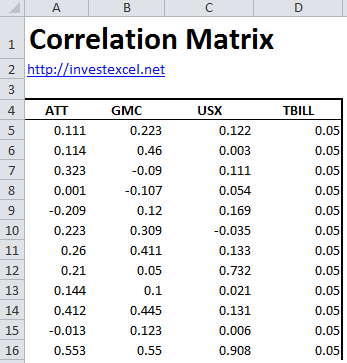
Step 1: Simple specify a matrix of N asset prices or returns. For this example, we have returns data for ATT, GMC, USX and US T-Bills in cells A5:D15:
Step 2: Select a results range that is N rows tall by N columns wide (in this case, four rows by four columns). Then type CorrelationMatrix(A1:D20).
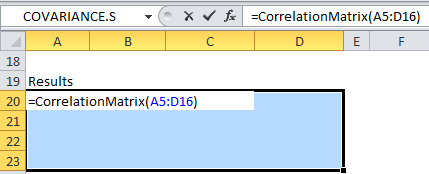
Step 3: Press Shift + Enter (this tells Excel that the formula will be a matrix formula). You’ll then see your matrix in your selected cells.
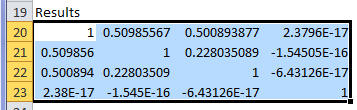
For these sample stocks, none of the investments are highly correlated, with the largest value being around 0.51. T-Bills (as expected from the constant returns over time) have practically no correlation with the other assets.
The VBA function can be viewed and used in your own spreadsheets.
Download Excel Spreadsheet to Calculate Correlation Matrix
Good stuff.
imho, there are two errors in the text:
– step 3:
you have to press Ctrl+Shift+Enter (so called CSE combination) to get your matrix instead of Shift+Enter (SE)
– step 2:
the story with “N rows tall by N columns wide” is not clear and does not correspond to the image (select A5:D16 – which makes sense).
Cheers
hi,if we have blank cells when calculate the correlation matrix,display all cells ####
what we to do?
my matrix is 30*30
I like this tool. Over what period of time is the correlation matrix being calculated? How would one change the historical time period for the calculations?