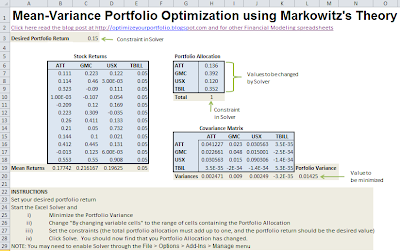
This Excel spreadsheet implements Markowitz’s mean-variance theory. It optimizes asset allocation by finding the stock distribution that minimizes the standard deviation of the portfolio while maintaining the desired return. A series of sample stocks are included, but the spreadsheet can be adapted to other stocks selections. Full instructions are within the spreadsheet, but click on the picture below for an overview.
You may need to enable Excel’s Solver by going to File > Options > Add-Ins > Manage
The genesis of modern portfolio theory was in the 1950s with Harry Markowitz’s pioneering work in mean-variance portfolio optimization. Before his innovation, finance was far more influenced by heuristics than by mathematical modeling. Mean-variance optimization is now the primary technique employed by hedge funds and pension funds for portfolio diversification.
Most investors trade risk off against the expected return. Mean-variance optimization identifies the investment portfolio that minimizes risk (i.e standard deviation) for a given return. The efficient frontier is the line that forms when the expected returns are plotted against the minimized standard deviation.
Mean-variance portfolio optimization has, however, several limitations.
- Employing standard deviation (or variance) as a proxy for risk is valid only for normally distributed returns. While this may be true for traditional stocks, bonds, derivatives and hedge funds demonstrate skew and kurtosis (which invalidates the application of Markowitz’s theory).
- The premise of the theory implies that investors will not alter their asset allocation after it has been optimized
- Investors or fund managers may not necessarily want to minimize risk (i.e. standard deviation). They may, instead, wantto reduce the correlation of a fund to a benchmark
Markowitz’s approach to portfolio optimization has been modified to account for transaction costs (which can make portfolio changes unprofitable) and to only penalize downside volatility (since most investors do not mind sudden large upswings in volatility).
Download Excel Spreadsheet for Mean-Variance Portfolio Optimization

Thanks for the wonderful spreadsheet. I did all the steps in the same way as you did in yours but i am getting Negative Portfolio Weights Do you know why that could be happening?
Did you try setting the lower-bound to zero when using the Solver (no short-selling)?
Guten Tag
Ich möchte gerne ein efficient frontier zeichnen mit full forward currency hedge (h= 1) und ohne currency hedging aber ich weiss nicht wie ich es zeichnen kann. Kann jemand mir bitte helfen? Vielen Dank
Thank you. This spreadsheet is very useful.
Would it be possible to run the Mean-Variance Optimization with more than 4 companies? How could I alter the spreadsheet to achieve that?