MFI combines price and volume to measure the momentum of price changes. Get a spreadsheet with automatic data download from the Internet here! Full VBA included.
Technical analysts use many indicators to predict the direction of price movement.
A popular class are those that measure momentum; these include Williams %R, Stochastic Oscillator, and the Commodity Channel Index.
The Money Flow Index is a member of this family, developed by a couple of clever traders called Avrum Soudack and Gene Quong. A trading strategy that use this indicator is described here.
How to Calculate the Money Flow Index
Step 1: The average of the high, low and close price is known as the typical price.
Typical Price = (High + Low + Close) / 3
Step 2: Then multiply the typical price by the trading volume. This gives the money flow.
Money Flow = Typical Price x Volume
Step 3: Now let’s calculate the Positive and Negative Money Flow
For a trailing time window (of usually 14 days),
- add the money flows where the typical price is greater than the previous day’s typical price. This is the Positive Money Flow
- add the money flows where the typical price is lower than the previous day’s typical price. This is the Negative Money Flow
Step 4: The Money Ratio is simply the Positive Money Flow divided by the Negative Money Flow
Step 5: The Money Flow Index is then simply calculated with this formula.
Money Flow Index = 100 – 100 / (1 + Money Ratio)
Excel Spreadsheet and VBA for the Money Flow Index
Assuming that the High, Low and Close Prices are in Columns C, D and E, and the volume is in Column G, this snippet of VBA will calculate the Money Flow Index.
The full code is in the spreadsheet associated with this article (scroll to the end for the download link).
'Typical Price dataSheet.Range("h1") = "Typical Price" dataSheet.Range("h2:h" & nRows).FormulaR1C1 = "=(RC[-5] + RC[-4] + RC[-3])/3" 'Money Flow dataSheet.Range("i1") = "Money Flow" dataSheet.Range("i2:i" & nRows).FormulaR1C1 = "=RC[-1]*RC[-2]" 'Positive Money Flow dataSheet.Range("j1") = "Positive Money Flow" dataSheet.Range("j3:j" & nRows).FormulaR1C1 = "=IF(R[0]C[-2]>R[-1]C[-2],R[0]C[-1],0)" 'Negative Money Flow dataSheet.Range("k1") = "Negative Money Flow" dataSheet.Range("k3:k" & nRows).FormulaR1C1 = "=IF(R[0]C[-3]<R[-1]C[-3],R[0]C[-2],0)" 'Sum of Positive Money Flow dataSheet.Range("l1") = "Sum of Positive Money Flow" dataSheet.Range("L" & timeWindow + 1 & ":L" & nRows).FormulaR1C1 = "=SUM(R[0]C[-2]:" & "R[-" & timeWindow - 1 & "]C[-2])" 'Sum of Negative Money Flow dataSheet.Range("M1") = "Sum of Negative Money Flow" dataSheet.Range("M" & timeWindow + 1 & ":M" & nRows).FormulaR1C1 = "=SUM(R[0]C[-2]:" & "R[-" & timeWindow - 1 & "]C[-2])" 'Money Ratio dataSheet.Range("N1") = "Money Ratio" dataSheet.Range("N" & timeWindow + 1 & ":N" & nRows).FormulaR1C1 = "=R[0]C[-2]/R[0]C[-1]" 'Money Flow Index dataSheet.Range("O1") = "Money Ratio" dataSheet.Range("O" & timeWindow + 1 & ":O" & nRows).FormulaR1C1 = "=100-(100/(1+R[0]C[-1]))" |
Here’s an Excel spreadsheet that does the heavy lifting for you.
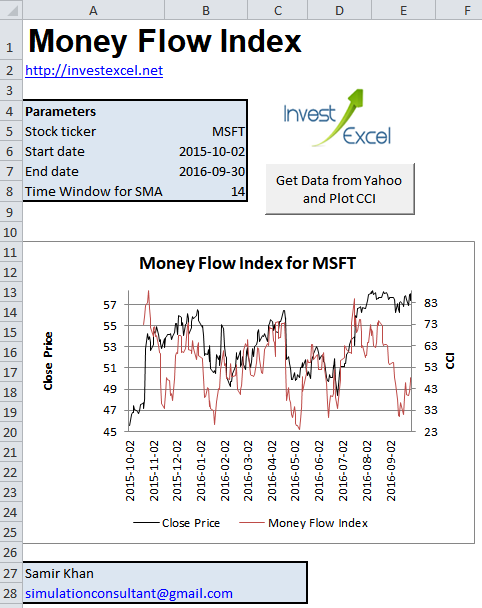
Just give it a ticker, two dates and a time window, then click a button. Some smart VBA downloads daily prices from Yahoo Finance, calculates the Money Flow Index, and generates a chart.
The VBA is not password protected; please learn from the code – VBA gives you much more flexibility than the standard Excel functions.
Money Flow Index Spreadsheet with Automatic Data Download from Internet