A few months ago I started looking at the BMO Resource Fund. In the past I’ve based far too much of my decision on historical returns. Historical returns are easy to understand, and I usually opt for the path of least work when investing. That’s simply human nature.
There are several other, perhaps considerably more significant, benchmarks that should be considered. A great source for these benchmarks is Google Finance. This time I decided to do some more background work before spending my hard-earned dollars.
The fund’s homepage on BMO.com gives its historical returns.
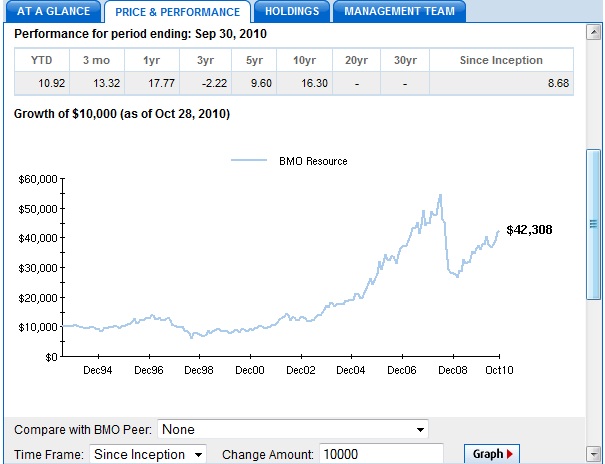
Apart from a large dip in 2008 (mirrored by other funds), it seems to have steadily grown over the last ten years. Given that it had returned near 18% over one year, I was tempted to invest my hard-earned dollars in it.
However, historical returns don’t tell you the whole story (and in many cases, they can be misleading). As I’ve learned from hard experience , based your decision solely on historical returns can make cost you money.
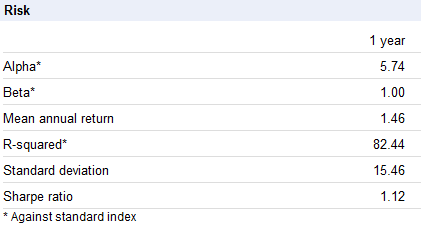
This time, I searched for the fund in Google Finance. If you do that yourself (for any mutual fund you’re interested in), and scroll to the section titled Risk. You’ll see something like this.
You’ll see benchmarks over the course of one, three, five, and ten years.
Alpha is the return over and above what would be expected for the fund, given the fund’s Beta. Values greater than one are better, a value of zero is average, while a value less than zero indicates that returns are not as good as you would expect
Beta is the volatility of a fund compared to an index. A beta of 1 means that a fund is just as risky as its index, while lower or higher values indicates that a fund is either less or more risky than its index.
For the BMO Resource Fund, the beta is one, indicating that the fund is just as risky as its benchmark . However, the alpha is above five, meaning that the fund has outperformed its benchmark.
The Standard Deviation is the average difference of a fund’s price from its average. If it’s a high value, it means the fund is risky. For the BMO Resource Fund, it’s just over 15.46%. I’d say that this fund isn’t for the easily scared.
The Sharpe Ratio measures how effectively a fund uses risk (as measured by the Standard Deviation) to generate return. It’s the ratio of the effective return (the historical return minus the return you would typically get in a bank) divided by the Standard Deviation. Given that interest rates are typically 0.5% and the one-year return for the BMO Resource Fund is 17.77%, the Sharpe Ratio is simply (17.77 = 0.5)/15.46 = 1.12. That’s the figure given by Google Finance. A value greater than one is considered good, while a value greater than two is considered excellent.
Based on the above figures I recently decided to invest a few thousand dollars in the fund. It’s less than 10% of my portfolio so the high volatility doesn’t worry me that much. Time will tell if I’ve made the right decision.