This Excel spreadsheet downloads multiple historical stock quotes into Excel. Just enter a series of ticker symbols, two dates, and click a button.
Update on 15th September 2024. Yahoo Finance made getting at the data a little trickier, but nothing that a little time and effort can’t resolve. Get the new version below!
Update on 2nd May 2022: Fixed to work past some Yahoo changes.
Update on 14th April 2018: Yahoo changed a few things, so I’ve updated the downloader to work again
Update on 11th July 2017: You can now sort the historical data in ascending or descending date order
Update on 6th July 2017: I’ve uploaded a new version of the Yahoo spreadsheet that now works again. Download the new version at the bottom of this article. Comments welcome.
Update on 20th May 2017: Yahoo Finance have discontinued their free historical data API. As a workaround, I’ve posted a new version of the spreadsheet that uses Google Finance.
This data can be used for correlation analysis, technical analysis with RSI and ATR, historical back-testing, portfolio optimization and much more.
A previous spreadsheet let you download data for a single ticker symbol. Sometimes, however, data for just one company isn’t enough – you need to compare the relative performance of several companies. That’s when you need this free, user-friendly spreadsheet for bulk data download.
The spreadsheet is simple to use. Start by entering a start and end date, your desired quote frequency (d for daily, m for monthly, y for yearly), and your desired sorting (oldest data first or newest data first).

You can also specify if you want the data for each ticker written to separate CSV files. If so, specify an export folder for the files.
Then enter a list of ticker symbols in cell A11 and below (one tick per cell). After you click “Get Bulk Quotes”, the spreadsheet downloads the historical stock quotes into individual sheets. The sheet name is the ticker symbol.
![]()
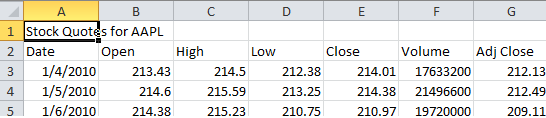
The spreadsheet downloads the date, open price, high price, low price, closing price, volume and adjusted close price.
If you add or remove tickers , or refresh the data, the spreadsheet deletes the existing quote sheets, and inserts new sheets with the new data.
If you asked the spreadsheet to export the data, you’ll find a CSV file for each ticker in the folder you specified.

The file name is constructed from the ticker, start date, end date, and the download frequency.
If you misspell a ticker or leave a blank, the VBA is clever enough to skip over or ignore the error. You won’t get any nasty error messages.

You’ll also get a list of tickers for which no data was found. This list is dynamically updated by the VBA.
I’ve tested the spreadsheet by downloading historical quotes for 180 ticker symbols. Everything worked perfectly, with 180 new sheets added to the workbook, each filled with historical data.
You can also collate the open, high, low, close, adjusted close and volumes for every ticker on the same sheet. That is, you can collect all the open prices on one sheet (named “Open”) together with the corresponding dates, all the high prices on one sheet (named “High”) together with the corresponding dates etc. Simply check the “Collate” button.

The collate feature correctly reconciles tickers that return data with differing time series – dates and values are correctly associated.
The VBA is not protected; you can view and modify the code. Please let me know if you have any suggestions for improvements or additions to the functionality.
Get Excel Spreadsheet to Download Bulk Historical Stock Data from Yahoo
Get Excel Spreadsheet to Download Bulk Historical Stock Data from Google Finance
Hi
I am trying to use your sheet “Multiple Stock Quote Downloader for Exce” to get quotes for 2148 stocks, the excel hungs because so many sheets are created. I don’t need the sheets to be created, I only need CSV exported, .. could you please help me add a LOOP to the VBA to process the long list 10 at a time, cleanup/delete created sheets the continue the loop.
I know I should be fine doing this manually with smaller lists, but if I could automate it it would be great
Thank you
Ron
I suggest
after “for ticker = 12”
If (ticker – 11) Mod 40 = 0 Then
Shell “RunDll32.exe InetCpl.cpl,ClearMyTracksByProcess 1”
Else
End If
If it runs fine for 180 then maybe you could do “mod 180” but a smaller number might be safer.
hi samir
cannot work on NSE data .
how can i get data from NSE : SBIN
its available on google finance though. and can get it on google docs
pls advise
Hi sameer,
You have did an excellent work, bit how could i use this to get data from indian stock exchange BSE and NSE. Kindly let me know thanks alot.
Hi Samir,
Wonderful work on the bulk stock data downloader. I just ran it and it was unable to return data for ^DJI and TMST (Timkensteel). All the others worked seamlessly, any idea on the 2 that didnt?
Thank You
-Martin
TMST – I successfully downloaded data for this ticker for the dates 19th June 2014 to 14 October 2014. Historical data for TMST doesn’t seem to be available further back than 19th June 2014.
^DJI – Yahoo does not provide programmatic access to historical data for this ticker.
Samir,
Thanks for your great worksheet. Grateful if you could suggest how to get from SSE A share index (000002.SS) and SSE B share index(000003.SS). Thanks
Yahoo do not provide historical data for those tickers (nor does Google Finance, for that matter)
Hi Samir
I have been looking for something like this for a while. Ideally I would like to add certain stock details such as Dividend Yield, Dividend Payout Ratio, P/E ratio,
Is there a way to add these sort of items? It would be really great.
Thank you.
hello samir,
sir i am small trader and looking for hedging strategy “SPREAD TRADING” I use your google 1 minute excel. is there any chance u can create intraday google data file with two stocks since currently im using two different file and third excel for deviation and average for line chart in excel…. plz help me with this to get through…
regards & Respect
Mak
Thanks for a very useful expertly crafted spreadheet. One bothersome detail that I noticed and I think I fixed: The number of connections in this workbook is currently 581. There is no need for any connections to be stored. Every time a stock symbol is requested that yahoo can’t retrieve a new connection is created. I added the following code to the “DownloadStockQuotes” subroutine to remove these connections and to prevent this from occurring:
at the top of the subroutine:
Dim C As WorkbookConnection
and below the error handler line label:
For Each C In ThisWorkbook.Connections
C.Delete
Next
Thank you for this tip. I’ve just added that code to the worksheet. Very helpful, thank you.
Never mind, you just use the “.TO” ticker. The spreadsheet is great. Many thanks!
Hi Samir,
I have been using your excel down loader since early October, to retrieve data for a 67 stock portfolio. Everything was working perfectly until 11.12.14, then for some reason the data retrieved for GS (Goldman sachs) is not correct. It is pulling data values in the mid 20’s? I have removed the ticker from the list, run the retrieval process, saved the file, and then went back and added the ticker again. However it is still pulling the wrong values. I have also went on to Yahoo.com and ran a historical quote retrieval for the period in question for GS and it generates the correct values. Any ideas what the issue could be? The other 66 stocks on the list are working fine.
Thanks
-Martin
Very nice application. The only issue is that the yearly frequency option (y) doesn’t work.
Hello Samir,
why the spreadsheet file I downloaded is .xlsm, it is opened with openoffice.org instead of MS Excel.
The Get the bulk button doesn’t show up at all instead a string of words. Could you help me through this?
I tried the same file with downloading single quote, it is the same thing.
Thanks in advance,
You’re out of luck. I’m not familiar with Open Office, but I don’t think it’ll run the VBA. You’ll need Microsoft Excel
Dear Samir
I have recently downloaded your file and used it.
following tickers are failing –
MOTILALOFS-EQ.NS
SHASUNPHAR-EQ.NS
Is there any specific reason. Can you resolve this? It will be a great help.
thanks
Yahoo does not provide historical data for those tickers
Hi Samir,
Good job!! Your code is simple and clean 🙂
I am willing to pay for the following modification (for metastock import program). The output required is:
,,,,,,,,,
AAPL,D,20000103,000000,26.2200,28.1300,25.4200,27.9800,0,0
instead of the current
Date,Open,High,Low,Close,Volume,Adj Close
2000-01-03,104.88,112.5,101.69,111.94,133949200,3.79
Possible?
Since this is a popular request, I’ll do this for free (but please donate a few dollars instead – whatever you think it’s worth).
Could you help me understand how you go from
Date,Open,High,Low,Close,Volume,Adj Close
2000-01-03,104.88,112.5,101.69,111.94,133949200,3.79
to
AAPL,D,20000103,000000,26.2200,28.1300,25.4200,27.9800,0,0
It’s not entirely clear.
Hi Samir,
I set up the sheet to retrieve daily prices for the current day for 166 securities. The process works perfectly creating individual sheets for every security on the list. However on the collate function, it only returns values for the first 135 securities on the list. I have tried multiple times and get the same results each time. The collate sheet is the most important to me as I have links to that sheet to pull current pricing into a risk management sheet. Any suggestions or insight would be much appreciated. Thank you for providing such a valuable tool.
-Martin
Email me the spreadsheet with the 166 ticker symbols. The code is designed to bail out if it sees something out of the ordinary
Very nice piece of VBA programming….crossplatform no less!
Much appreciated.
BTW in case it helps, Excel 2011 for Mac produced an error for (in the DownloadData routine):
For Each C In ThisWorkbook.Connections
C.Delete
Next
It said “Method not found” for “.Connections”
I remarked out the loop and everything was smooth from there on in.
THanks again!
Hi Greg,
Had the same problem but I just made it work. I removed these lines from the code and it worked.
Scroll up and remove the line of code “Dim C as WorkbookConnection” and remove the lines you mentioned in your question as well then try running it again.
Hi Samir,
First, off, I’d like to commend you on this. Great job! I like to look at seasonal pattern of a stock. Would you be willing to add codes/formula that ranks stocks based on average gain and then another sheet showing average winning pct for all 12 months over the past X number of years? I’d be willing to pay for this. The raw data is nice, but I would love to see it presented in a performance format. Could you please contact me if this is possible.
Thanks!
Hi Samir, can we have prices in four decimals?
Hello Samir,
I use the excel Bulk Stock Quote Downloader, and it works very well. But yesterday and today, I can not downlad anything.
Do you know if there is a problem with yahoo…? or something has change..?
Thank you.!
It still works for me
Thanks for all you do!
A quick heads up. Yahoo has a data error on 11/24/14 for closing and adj close of DJIA in the download source data; however, when I look at data on Yahoo Finance, data shows correctly.
11/24/2014 6426.45 6475.94 6400.75 6433.23 3128060000 6433.23 – from download
Nov 24, 2014 17,812.63 17,855.27 17,793.19 17,817.90 85,510,000 17,817.90 – from Yahoo Finance website – is there a way to correct your source dataset? I will try to contact Yahoo.
Also, I am suspecting that Yahoo historical data (several years back) has changed for djia since one of my trading systems that uses the historical data is now showing different results for prior years… I am still researching but wondering if anyone has seen these types of changes. FWIW, I use adjusted data values in all studies.
Update – I left a comment on Yahoo finance asking them to fix 11/14/14 bad data on DJIA.
Re: second issue, further analysis showed Yahoo Finance does not list data for 11/23/14 for the ^XAU index and that was skewing my calculations.. not sure why became market was open that day. I’ll leave them another request to fix this.
Thanks
correction, should read 12/23/14 for missing ^XAU data
Hi,
I am trying to run the downloader today and all of my tickers are failing Is it because it’s the weekend? Will this work tomorrow morning?
Thanks,
HS
Tried it myself, works for me. Try again tomorrow
Help. I used to use “existing data connections” in an excel spreadsheet to connect to MSN Money Central Investor Stock Quotes and download current stock prices to a list. This service is no longer available. Where can I find a replacement for this service? I am currently using google finance, but the spreadsheet there is really inadequate.
For anything serious, I now use an add-in called MarketXLS:
http://technitya.com/content/stock-quotes-excel?source=investexcel
(affiliate link, but that hasn’t affected my opinion of the product; use coupon code investexcel for a 20% discount). It does a lot, and is well worth the money.
Thanks for sharing your spreadsheet.
I’m an electrical engineer stock dabbler, and found your spreadsheet from a Google search.
It works well! (now I’m trying to find out HOW it works.)
Hi Samir,
What you have done here is awesome. Thank you so much.
I went into the code to try to delete the first line (name of stock) saved into each CSV file. My coding skills are quite limited, unfortunately, and have been having trouble changing the code. I got real close but for some reason the first row now contains the most recent date (second row and beyond are all correct). Thought this would be an easy fix from here but I can’t quite get it down. Some help would be appreciated!
Regards,
Ziad
Seems just what I’ve been looking for, but doesn’t work on Office 2000. Any chance of an older version and unprotected VBA code so I can amend to work in the UK.
Great job by the way.
Thank you
Sorry, no chance of an office 2000 version
I am running this sheet off of excel 2011 on my mac. Is there a reason I keep getting a window that says:
Compile Error
Method or data member not found
Perhaps that version of Excel doesn’t run VBA? I don’t have a Mac (let alone that version of Excel) so I can’t troubleshoot
Hi Samir
Stunning – The world needs more people like you. Radiators always giving. Thanks
Your generosity drives me to do the same.
i have been using your program for a few days. Like everyone else I have been looking for something like this. I have not started my investments as yet and would have been delayed a lot longer had I not found this. It is wonderful. If the lord is kind and I make some serious cash I will donate to your site heavily.
I don’t know much VBA but sufficient with the help of forums to add to the tables. I am now wondering how I am going to add the 50 day Simple moving average. My criteria is quite simple. I sell if the stock goes below 5% from its highest. So i use your highest and add more bits but i would also like a 50 SMA and am not sure how to add this. Clearly where you add the other bits I will start this
Thanks
All the bet
Mark
Anyone having problems with the Adjusted Close tab after this week’s Windows 8.1 update? The macros seem to stop at some point while converting points and decimals. When using file version that worked previously I get the same errors, meaning that something in the environment has changed.
Any feedback would be highly welcome!
Hi, Samir.
You are doing a great job, this is amazing.
This stock downloader and other files is amazing.
Just wanted to say thank you.
Hi Samir
Many thanks for this useful spreadsheet!
I noticed that the collated data (open, high, low, etc.) is only calculated for the first few tickers. Would you let me know when and if there will be a new version of the worksheet available that collates data for many tickers, e.g., 20 and more?
Thanks!
There’s no limit on the number of collated tickers. There must be some other issue.
Hi Samir,
The spreadsheet seems only to collate the first five tickers; see the link below.
https://www.dropbox.com/s/hqgi872p8dsvyso/Multiple%20Stock%20Quote%20Downloader_error.xlsm?dl=0
Best,
Frank
Hello Samir,
Could you please help me with a problem apparently nobody has that is posted above on April 17th. I tried to narrow down the problem but it already occurs with one single ticker (CURE) using one single day (April 30). Once I click “Get bulk quotes” and look at CURE’s low price I see 13.800.999 instead of 130.80. Similar things happen with other quotes as will but not all on the same day and not only with the low price. Examples are SHY, UST, UBT. But other tickers are no problem, ever. By the way, when I download the Yahoo data straight away I can’t see any problem within their data.
In the example above if I take an other date, let’s say April 29, things are working just fine. What could possibly be wrong???
Thanks and best regards,
Joop
Bravo !!!
Excellent workbook.
However, it fails when downloading some tickers, for instance SPY. The problem is with formatting, the decimal separator is misplaced !
For example
The open for 28 April 2015 is 21,074,001 usd
The adjusted close for 29 April 2015 is 21,057,001 usd
In both cases the quote shown is 21 Million usd !
The problem probably comes from a confusion in the decimal separator. In my computer I use the Spanish international settings where the decimal separator is the “comma” and the thousands separator is the “point”.
Is there a way to fix this problem?
Best regards and thank you
Stock Quotes for SPY
Date Open High Low Close Volume Adj Close
2015-04-27 212.33 212.48 21.053.999 210.77 78605500 210.77
2015-04-28 21.074.001 211.50 209.33 211.44 84482200 211.44
2015-04-29 211.44 211.44 20.960.001 21.057.001 121653600 21.057.001
2015-04-30 209.88 21.035.001 207.62 20.846.001 148619200 20.846.001
2015-05-01 20.939.999 210.77 209.28 210.72 96722000 210.72
2015-05-04 211.23 212.02 21.110.001 21.132.001 68949200 21.132.001
Hello Samir,
My problem, just posted, and the one from “joop” (posted just above) are exactly the same.
Best regards
Hello again Samir,
Please have a look at the CSV generated with the download. You can see the quotes at 21 million usd. Hope this helps
Stock Quotes for SPY,,,,,,
Date,Open,High,Low,Close,Volume,Adj Close
2015-04-27,212.33,212.48,”21,053,999″,210.77,78605500,210.77
2015-04-28,”21,074,001″,211.50,209.33,211.44,84482200,211.44
2015-04-29,211.44,211.44,”20,960,001″,”21,057,001″,121653600,”21,057,001″
2015-04-30,209.88,”21,035,001″,207.62,”20,846,001″,148619200,”20,846,001″
2015-05-01,”20,939,999″,210.77,209.28,210.72,96722000,210.72
2015-05-04,211.23,212.02,”21,110,001″,”21,132,001″,68949200,”21,132,001″
Thank you
Hello Samir,
I have the same problem like Joop for several Symbols.
Just try “SPY”
for 1st May I get Close Price 210.72 as text
for 4th May I get Close Price 21132001 as number.
The problem I have for several symbols random in a colume. Data are not usable.
Thanks for ideas to fix it.
best regards,
Matt
It’s fixed now. Download the updated version.
Hi Samir,
There seems to be a problem with the TextToColumns property in VBA. Because of this problem, a quote that should read 130.80 appears as 13.800.999.
After some tests, I think I have solved the problem.
In the VBA macro, when converting TextToColumns, please add the following
DecimalSeparator:=”.”, ThousandsSeparator :=” ”
A programmer will know how and where to put it.
With this change, everything seems to work.
Best regards
Hi Vicente,
Thanks for your idea.
I put it in in row 98 and it doesnt work.
May your can specify how you put it in.
Thanks in advance,
Matt
Vicente, I tried this:
Columns(“a:a”).TextToColumns Destination:=Range(“a1”), DataType:=xlDelimited, _
TextQualifier:=xlDoubleQuote, ConsecutiveDelimiter:=False, Tab:=True, _
Semicolon:=False, Comma:=True, Space:=False, Other:=False, FieldInfo:=Array(Array(1, 1), Array(2, 1), Array(3, 1), Array(4, 1), Array(5, 1), Array(6, 1), Array(7, 1)), _
DecimalSeparator:=”.”, ThousandsSeparator :=” ”
Thanks for the fix. I’ve added it to the worksheet. Very helpful, Vicente
Wonderful script …
Great work Vicente!
However, I have no clue where and how to modify the script. And maybe Samir doesn’t have the time to update the original version. Is there a way you can lead us through the modifications? Or is it too difficult?
Thanks and best regards,
Joop.
I’ve just uploaded the fixed version
And again it’s working like a charm…
Thank you so much Samir!!!
Joop.
Samir,
Can it be that there’s a small error due to the last update? Today it’s the 19th and the historical prices on Yahoo Finance already show prices for the 18th. However, while End Date (parameter sheet) says 2015-05-19 the result sheets all show 2015-05-15 as the latest date. I would have thought the data of 2015-05-18 was included. I haven’t noticed this in the past.
Thanks again!
Joop.
Nothing I’ve changed would have affected that.
Thanks Samir.
When I checked at 05:44 PM it didn’t work. However, I tried again after the close of the markets and now it DOES work. So either something changed directly after the market’s close (but a working day late) or something strange is going on. I’m in the Netherlands so the difference between the 2 moments can’t be time zones, correct?
I wished I had added the question at what moment the updates daily closes should be available in the stock quote downloader. I assumed as soon as the info is available on Yahoo but maybe you do a date and/or time check?
Joop.
Can this format be used to download commodity data, i.e. corn, soybeans, etc.?
HI Samir,
your Excel file is excellent !
However I have tested some quotes for Paris stock place and I also noticed a difference of date.
this issue is nearly the same as Joop one
For example let s say for ERA.PA closing is at 74.09 € the 28th of may (17h30 PM , local time)
Yahoo.com give the correct closing price at this time, but when I run the stock downloader with a closing date at 2015-05-28 : the last downloaded date is the 27th.
I don’t understandwhy the macro ends one day before.
Did anyone notice this ?
Jamir, thanks for your works !
steph
Hi Samir,
Thanks again for this excellent VBA. “Normal” stocks collate fine, but when I try to download the Singapore stocks below, the code only collates six stocks and leaves the others out. This is the case in Excel 2007 (32 bit), Excel 2010 (64 bit) and Excel 2013 (64 bit). Does anyone else have the same problem?
A17U.SI
A68U.SI
ACV.SI
AU8U.SI
AW9U.SI
C2PU.SI
C38U.SI
C61U.SI
D5IU.SI
F25U.SI
J69U.SI
J85.SI
J91U.SI
K2LU.SI
AJBU.SI
K71U.SI
M1GU.SI
M44U.SI
N2IU.SI
ME8U.SI
ND8U.SI
O5RU.SI
P40U.SI
Q1P.SI
Q5T.SI
RW0U.SI
SK6U.SI
SK7.SI
SV3U.SI
T82U.SI
T8B.SI
T8JU.SI
TS0U.SI
UD1U.SI
Samir,
I applaud you for making great and useful software. I have tried your Multiple Stock Quote Downloader, and it works wonderfully. It is a very useful tool.
I have observed a strange thing that happens. When I put in the ticker symbol ^HSI for the Hang Seng Index, it is automatically changed to ^HIS. I do not understand why this is happening. Of course, when the ticker symbol is changed automatically by excel, then excel cannot download the data from Yahoo (because there is no data for the changed symbol).
Can you comment why this is happening?
Thanks,
Tom Bahder
Hi Samir,
It is a remarkable work you make.
But I failed to download for Indonesian stocks.
Can you change to download data from Yahoo finance or other that have indonesian stocks?
Thank you,
Wiro
Sorry, my bad it succed. After I tried again and change some.
Hi Samir,
I tried to make a modifications and not work.
Can you add columns for cci 5 days column(Close), SMA 20 days(Close), SMA 40 days (Close) , and the stock name appear in the parameter sheet if the cci below -100?
I can give you my excel as example of CCI 5 days formula.
and how much I should pay?
I tried to modificate my excel and not work
Can you add columns for cci 5 days column(Close), SMA 20 days(Close), SMA 40 days (Close) and let them appear on parameter sheet if cci below -100?
I can give you my excel as example of CCI 5 days formula.
And show the stocks name which cci is below -100.
and how much I should pay?
Regards,
Wiro
Samir,
You’ve done an amazing job. Kudos to you my friend.
One favor: can you modify the code a little bit to only display the summary sheets (Open Price, High Price, … etc.) instead of creating new sheets for each stock? I would like to do this for hundreds of stocks at a time and it’s not practical to create so many individual sheets.
One solution is to simply delete all the stock ticker sheets after the fact but that’s highly inefficient.
Many thanks,
Jeremy