This Excel spreadsheet downloads multiple historical stock quotes into Excel. Just enter a series of ticker symbols, two dates, and click a button.
Update on 15th September 2024. Yahoo Finance made getting at the data a little trickier, but nothing that a little time and effort can’t resolve. Get the new version below!
Update on 2nd May 2022: Fixed to work past some Yahoo changes.
Update on 14th April 2018: Yahoo changed a few things, so I’ve updated the downloader to work again
Update on 11th July 2017: You can now sort the historical data in ascending or descending date order
Update on 6th July 2017: I’ve uploaded a new version of the Yahoo spreadsheet that now works again. Download the new version at the bottom of this article. Comments welcome.
Update on 20th May 2017: Yahoo Finance have discontinued their free historical data API. As a workaround, I’ve posted a new version of the spreadsheet that uses Google Finance.
This data can be used for correlation analysis, technical analysis with RSI and ATR, historical back-testing, portfolio optimization and much more.
A previous spreadsheet let you download data for a single ticker symbol. Sometimes, however, data for just one company isn’t enough – you need to compare the relative performance of several companies. That’s when you need this free, user-friendly spreadsheet for bulk data download.
The spreadsheet is simple to use. Start by entering a start and end date, your desired quote frequency (d for daily, m for monthly, y for yearly), and your desired sorting (oldest data first or newest data first).

You can also specify if you want the data for each ticker written to separate CSV files. If so, specify an export folder for the files.
Then enter a list of ticker symbols in cell A11 and below (one tick per cell). After you click “Get Bulk Quotes”, the spreadsheet downloads the historical stock quotes into individual sheets. The sheet name is the ticker symbol.
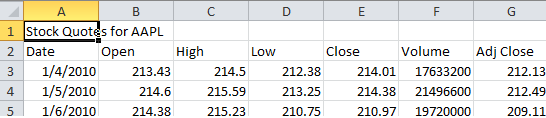
![]()
The spreadsheet downloads the date, open price, high price, low price, closing price, volume and adjusted close price.
If you add or remove tickers , or refresh the data, the spreadsheet deletes the existing quote sheets, and inserts new sheets with the new data.
If you asked the spreadsheet to export the data, you’ll find a CSV file for each ticker in the folder you specified.

The file name is constructed from the ticker, start date, end date, and the download frequency.
If you misspell a ticker or leave a blank, the VBA is clever enough to skip over or ignore the error. You won’t get any nasty error messages.

You’ll also get a list of tickers for which no data was found. This list is dynamically updated by the VBA.
I’ve tested the spreadsheet by downloading historical quotes for 180 ticker symbols. Everything worked perfectly, with 180 new sheets added to the workbook, each filled with historical data.
You can also collate the open, high, low, close, adjusted close and volumes for every ticker on the same sheet. That is, you can collect all the open prices on one sheet (named “Open”) together with the corresponding dates, all the high prices on one sheet (named “High”) together with the corresponding dates etc. Simply check the “Collate” button.

The collate feature correctly reconciles tickers that return data with differing time series – dates and values are correctly associated.
The VBA is not protected; you can view and modify the code. Please let me know if you have any suggestions for improvements or additions to the functionality.
Get Excel Spreadsheet to Download Bulk Historical Stock Data from Yahoo
Get Excel Spreadsheet to Download Bulk Historical Stock Data from Google Finance
Hi Samir
Thanks for your excellent file. I just started to use VBA and I want to include other variables such as P/E ratio. Which part of your coding do I need to adjust?
Thanks in advance!!!
Hi Samir. Thanks for sharing your excellent work. Question – why do my new tabs that I create disappear each time I rerun the quotes? Is there a way to prevent this? Thanks in advance.
It’s the way I programmed it. The new sheets (with the historical data) are deleted overtime you update, and replaced with new sheets. You could dive into the VBA and alter the behavior
Great job Samir. This spread sheet is Awesome. I am using the spread sheet that preserves the data after column H. The only problem I am having is the spread sheet will not download today’s information even many hrs after the closing. It will download everything up to todays date. If I type in an ending date that is not on the current day it works fine, but it wont give the current days info. I am using the day frequency. I am using Excel 2010
Any help would be much appreciated.
I am very familiar with VBA. My question is this: how would I find the yearly average for the DOW? I’m trying to get the values from 1900 onwards. Anyone’s help would be greatly appreciated.
Hi Samir, great macro, however i tried a french stock, air liquide, and i can’t get any reading. Any clue, or is it programmed just for US stocks?
Try the ticker AI.PA
Hey Samir, I’m new to VBA and this macro has been awesome for a project I’m working on! I noticed after reading through the thread that a few people posted requests for a file where you could download historical quotes for multiple stocks and have them show up on the same tab rather than separate tabs. Is this available on investexcel site or have you created something with this capability?
I’m trying to download 5 year historical prices for all the stocks in the S&P 500, but need them aggregated so I can drop in an MS Access database.
Any assistance would be greatly appreciated. Thanks!
Download the updated file at the bottom of the post. There’s a new (experimental) collate function that collects all the close prices for each ticker on one sheet together with the date, all the open prices for each ticker on one sheet together with the date etc.
If you like the spreadsheet, then share a link to https://investexcel.net – that’s all I ask!
Hi Samir,
is it possible to get only the close, open, volume etc. sheets?
Because I need 1000 stocks to compare them and the sheet need very long time to calculate every sheet for the ticker.
How can I just get only the close, volume etc. data, without every single ticker sheet?
Thank you
Regards
Aida
You need to create the individual ticker sheets – can’t get around that. However, you can delete them afterwards with VBA.
Samir
is it possible to get stock prices from other sites with this excelsheet
If you can find the right web site and data feed, then yes
Hi –
I’ve found an interesting problem with the Collate function: as far as I can tell, it uses the dates retrieved for the first stock entered in the parameter list and assumes that there’s historical data available for all of stocks for the period selected and so creates the collated tabs with the first date in the range in the first row, the second date in the range in the second row and so on. This creates a problem when some of the stocks in the list don’t have any historical data for the beginning of the period, e.g. they didn’t start trading until sometime later in the range. For example, if I select the range 1/1/2012 to today and use GOOG and PSX (PSX didn’t start trading until 4/12/2012), the collate tab places the data for PSX on 4/12/2012 in the first row which is 1/3/2012. Similarly, if I list PSX first and then GOOG, the first row of the Collate tabs is 4/12/2012 but the value for GOOG on that row is actually the data for 1/3/2012.
I suppose the only way around this would be to add some code to actually look at the date values on each stock’s tab and then copy the data to the correct row on the collate tabs. Samir, is this something you could add?
Thanks for making all these spreadsheets available – they’re really great!
Stan
I’ve updated the spreadsheet to reconcile time series of differing lengths. Now values and dates are correctly associated on the “collate” sheets.
Consider donating or linking to http://InvestExcel.net if you like the spreadsheets that much 🙂
Samir
First of all; absolutely amazing work Samir.
It would be great if I could add some additional sheets without them getting deleted when I run the macro in the parameters sheet.
I have tried to modify the VBA, but I am new to this so I had no luck. Can I add a few names of sheets that should be deleted?
Please advice,
K.T.
I think I can add this option. Bear with me.
Hi Samir,
Thanks for your reply. It would be absolute amazing if you could add that feature.
I have tried to add “Newsheet” to the line below from the VBA and it seemed to work. However, when I open the spreadsheet a week later and run the macro the new sheet is deleted again.
If ws.Name “Parameters” And ws.Name “About” And ws.Name “Newsheet” Then ws.Delete
I am clearly doing something wrong, but I cannot figure out exactly what it is.
Please advise,
K.T.
Hi Sameer,
Thanks for making this spreadsheet available for public use. It’s a great work. However, when I try to download the stock prices for any other exchange but NYSE/NASDAQ (such as NZ Stock Exchange or NZE), the spreadsheet doesn’t work even though the prices are listed in Google Finance. Could you please advise on what could be the reason behind it?
Hi Samir
For any search I get “no data for theses tickers” and it gives me back all the tickers i posted, how can I correct this?
actually it worked with another post from above..
But I have another question. It is not finding 2 stock quotes I’m trying to retrieve, one is FEMSAUBD.MX and the other one PE&OLES.MX. Could you help me with this?
Thanks.
FEMSAUBD.MX and PE&OLES.MX work for me.
Samir,
I have been using your spreadsheet for several months now to download 200 quotes at a time and it has worked perfectly. But when I use it now, it randomly skips several symbols and puts them into the no data column. However, when I look them up on yahoo finance, they all have data. Any help would be greatly appreciated.
Thanks
Jason
Jason
This is a function of the load on the Yahoo servers and how willing they are to play nicely. I can think of a workaround that may work, but it’ll take time to develop.
Donate a suitable amount (given the “several months” you’ve used the spreadsheet) and I’ll develop it (I have other demands on my time, including bills to pay)
Samir
Thanks for the reply, but I just got it working. It was something wrong with microsoft excel. I uninstalled and then re-installed office and now it is working fine. I do plan on making a donation after the New year, I’m tapped out right now from Christmas and bills. Thanks again for an excellent spreadsheet.
Samir,
Since your moderator decided to delete my last comment I will not be donating now or ever. I am also going on every excel forum I am a member of to tell others not to donate to your site. Thanks for nothing.
Jason
I moderate and approve the comments myself. You posted the comment while I was sleeping. Get a grip, son.
Samir
Samir,
This is the first time I stumbled upon your work. Great job and thank you.
One note: I successfully broke the app! Here’s how: When loading a portfolio with the symbol for Lowe’s Corp, the app “broke” and would not collate. Can you guess why?
The symbol for Lowe’s is “LOW” and once its worksheet was formed, it interfered with the collate function attempting to create another Low tab. lol.
The only enhancement I could possibly suggest would be a field for dividends.
Joe
Dear Mr Khan,
I would like to take this opportunities to thank you for developing such as
handy tools.
However I have a question for the collate data. If I would just like to
output only the top five rolls of the collate data sheet (i.e. Volume) rather than
the entire peiod to minimize the calculation.
I don’t want to create more work for you. Any thoughts or ideas would be greatly appreciated.
Thanks!
Regards,
Kan
The multi stock down loader sheet does not work now. Maybe Yahoo have changed something.
Just fixed it. Redownload the new version
Wow….that was quick. I have been looking at sites on the internet for a multiple stock quote downloader into Excel these past few days and came across this site and was amazed at how simple and therefore how good your multiple stock quote downloader was. After trying it out yesterday and realising how good it was I was a little disappointed to find that it did not work today and left a comment saying it does not work now. Within a few hours you replied that it had been fixed. Excellent stuff. I now intend to thoroughly read through your entire website over the next week. Well done Samir and a happy New Year to you.
Thanks! Please consider linking to investexcel.net or perhaps donating!
Please help me how to extract below field value from Yahoo finance Key statistic thru macro :
Debt To Equity,Share Outstanding,Profit Margin and Return on Equity
Use this spreadsheet: https://investexcel.net/company-financial-information-web/
Samir,
Thanks for providing the above link .I have already written my macro since i am able to get the yahoo tag . But for Return on Equity,Profit Margin,Debt To Equity i am unable to find the tag. For share outstanding i am using j1 but its not working
“http://in.finance.yahoo.com/d/quotes.csv?s=” & Symbols & “&f=snl1hgvj1b4ers6p5p68”
I have checked your excel but didn’t find the my above fields .Could you please help me to provide the tag for the above fields
*Small correction – using j2 for sharing outstanding
Samir,
Is it possible to change the macro to allow repetitions in the ticker section? for example, have the Apple ticker symbol be repeated in the list more than once.
right now, if there’s a repeated stock ticker, the macro asks me to delete any repetitions before it is able to produce the daily stock prices for the listed tickers.
thanks a lot.
Samir,
I am having an issue with your spreadsheet and I was hoping you would have an idea why. I just downloaded your file and tried to run it keeping all default locations and tickers but checking the “Write to CSV” check box.
I get the following error:
Run-time error ‘9’:
Subscript out of range
I have enable macros and basically ran the sheet as downloaded. Please advise.
Thank you!
Dave
Great work Samir!
I appreciate your generosity and have recognized your work by presenting your website to my Financial Markets class.
I do have ONE question though, it is likely a quick fix…
As far as the COLLATE command goes, when I use only stock tickers the macro runs properly. However, when I try to get data for indices that have a ” ^ ” before the letters (example: S&P 500’s ticker ^GSPC) the data does not collate properly.
I am wondering
1) How can I fix this?
2) Is there a way I can edit the macro such that it collates the data in Excel’s “table” format?
Thank you again!
Zack
I’ll look into the Collate data issue.
Thanks for presenting investexcel.net to your class 🙂
Samir
I have three questions:
1) Is there a way for the date to be formated as yyyy-mm-dd? (Someone else asked the same question but it was left unanswered)
2) Can the first line not have “Stock Quote for….” , but keep Date, Open, etc the same on Row 2
3) Remove ,,,,,, at the last row?
Donation made for this wondeful tool!
Check your mail
dear Samir,
Brilliant site and great excel VBA power. I’m using ur stock quotes downloader for Yahoo. Too bad you delete all sheets. If one creates extra sheets the code deletes all sheets except the parameter sheet. Would be nice that only the ones right of the parameter sheet are deleted then one can add sheets to the left of the parameter sheet to do analysis without the sheets being deleted.
Just my two cents 🙂 other then that Keep up the good work, very impressive
regards
JL
Many people have requested this feature. I’ll program it into the VBA.
All,
Firstly thank you tons Samir. This is awesome. The one issue that I have is the same as DavidS above.
When I run export to csv it comes through with a Run-time error ’9′:
Subscript out of range
I am running Office 2013 and Windows 8.1, I’m guessing something may have gone awry there. Does anybody have an answer what might be causing the runtime error?
It will write 1 symbol and stop after that. Thanks for any help.
Hmmm….I use Office 2010 64 bit and Windows 7 64 bit. Export to CSV works fine on my machine…I might download a trial of Office 2013 to see if I can reproduce the issue
AS OF TODAY THE HISTORICAL QUOTES DOWNLOADER IS NOT WORKING.I THINK YAHOO HAS CHANGED THE URL.PLS UPDATE YOUR FILE AND PLS PROVIDE A DOWNLINK TOUR GREAT UTILITY.REGARDS
Still works for me.
Hello Samir
This is a really nice tool that I have tried before. However, now when I downloaded it it no longer seems to work. Do u have any idea why?
What happens it nothing is downloaded and all specified tickers returns no data. And they all turn up in the “No data for these tickers” box.
Thanks for all your great work.
Hi Samir,
Very nice sheet.
However, I have list of 600 tickers and I can’t process it in a nice way with the sheet.
So, is there a possibility to make a customized sheet where there are no separate sheets made for each ticker?
Thanks in advance.
Warmest regards,
Jay
Jay
You could write some VBA that deletes the separate sheets after the worksheet is run (if the collate button is checked).
Not sure if you can download quotes for 600 tickers with the sheet though. I’ve retrieved information for 150 tickers, but haven’t tried any more than than.
Samir
Samir,
Great work. Thank you for this tool. I noticed that the last row of data in your collated worksheets does not populate across all columns (only the first symbol/stock). Why is this?
Hello Samir,
I seem to be having problems using the file on a Mac… all of the spreadsheets are empty. Any tips?
Hello Samir ,
You have created a nice spreadsheet but i am trying to get the same amount of data in a different way i want to the data in form of date , Volume and Adj CLose in one sheet how can i do can you please help me asap.?
I customize spreadsheets on a paid-for (consultancy) basis. Write to me at the email address at the bottom of the Privacy Policy page if you’re interested.
Samir,
First of all, really good spreadsheet.
For some reason, today the spreadsheet is not working. The success for the tickers is very low.
Thanks,
John
HI Samir,
today the Multiple Stock Quote Downloader for Excel get problem.I have 10 stocks on list. When I changed the start date, normally all last day quotes of the 10 stocks in same row in thier own worksheets. but today, they are located in different row, for example some in rwo 200, some in 206, some in 211.
This is first time I met such problem since I use your program from Feb. Need your help. Thanks a lot.
Hi Samir,
I can’t get this to work with Excel 2003, how to modify it?
Hi Samir,
Great work.
I would like to know if you have the same kind of excel file available for downloading historical data from google finance
Please also let me know if you have the same kind of excel file to download bhavcopy from nse for the selected date ranges. Its bit urgent. Please reply as soon as possible. Thanks
“Its bit urgent. Please reply as soon as possible”.
Why should I do this?
Hi Samir,
The xls doesn’t seem to work when I try to call certain names, ie EXMT. Instead of generating summary worksheets with all the names in my as expected, only 1 name populates.
Also, the most current requested day does not populate ANY time (even outside the above example)
Any suggestions?
Thanks,
Paul
Hi,
This is really excellent : thanks a lot for sharing that with us !
If I may, I’d like to make 2 remarks and 1 question :
– I think there is a small bug : for all the “Open”, “High”, … tabs, there are missing data on the last line (the line of the “End Date”)
– So, if “Start Date” = “End Date” (when we want only the today quote), the tables in the “Open”, “High”, … tabs are wrong : the column header is no more there
– It’s working for some stock tickers like : F000000DR5.PA or FR0010532101.PA
but It’s not working for some stock tickers like : FR0010217141.PA or FR0010914994.PA
which is very strange for me because for all of them the basic Yahoo requests :
http://fr.finance.yahoo.com/q?s=F000000DR5.PA&ql=0
http://fr.finance.yahoo.com/q?s=FR0010532101.PA&ql=0
http://fr.finance.yahoo.com/q?s=FR0010217141.PA&ql=0
http://fr.finance.yahoo.com/q?s=FR0010914994.PA&ql=0
are giving correct results
Any idea ?
tks in advance
Samir hi, thanks for providing these spreadsheets for everybody to use. Would it be possible to get a spreadsheet to download that combines the ability to download multiple stocks (this is the spreadsheet on this page) AND include the functionality to calculate multiple EMA’s at the same time, please?
There is a separate spreadsheet that can be used to calculate one EMA at a time that I saw, but I couldn’t find a spreadsheet that allowed for what I am requesting in this post. Of course, there is no reason why you should provide this, but if you would consider it, it would be a massive time saver. For me, personally, anyways.
Thanks for the valuable contributions, it is appreciated.
Paul
Hi,
First of all I want to thank you for sharing this!
I had some problem with tickers including a hyphen, e.g. as in HM-B.ST. The spreadsheet works very well, except when I try to Collate data. The stock tickers containing a hyphen has empty columns in the collated data sheets. I have no experience in VBA, but i managed to fix it by change the code a bit.
I changed:
Sheets(“Adjusted Close”).Range(Sheets(“Adjusted Close”).Cells(2, i), Sheets(“Adjusted Close”).Cells(maxRow – 1, i)).Formula = _
“=vlookup(A2,” & ws.Name & “!A$2:G$” & maxRow & “,7,0)”
to:
Sheets(“Adjusted Close”).Range(Sheets(“Adjusted Close”).Cells(2, i), Sheets(“Adjusted Close”).Cells(maxRow – 1, i)).Formula = _
“=vlookup(A2,” & “‘” & ws.Name & “‘” & “!A$2:G$” & maxRow & “,7,0)”
(and implemented the same change for all sheets)
However, i expect that there is a better/alternative solution and that it may be something you want to implement in a future release.
Thanks again!
Hi Samir,
What a great spreadsheet! Thanks very much for sticking it up and allowing those of us who are willing to muck about with the VBA adjust it to suit our needs. My problem is I know as much about where to go for the data as I do on how to write the VBA code to go and get it! If you could find time to point me in the right direction on both counts I would be very grateful.
My query is this: how do i ensure that it is picking up the data for stocks listed on LSE:AIM? One of the quotes I’ve already run returns answers that are too big and must be in cents for US markets, i assume? Also, I am looking for mid prices, not trade prices. The scheme I am trying to work on needs historic data for open, high and close prices, to allow some prediction of trends (or at least, that’s the theory!).
Look forward to hearing from you if you have the time – in turn, I will publish my own notes on how I got on, here, to assist others.
Thanks,
Mr T
Hello Samir,
Why i cannot download data for KLSE?
Tq
Hi Samir,
Thanks, very helpful idea for small retail investors like me. I couldn’t use the spreadsheet as such, as it returned only blank sheets. I noted few errors, yet trying to fix.
Seems yahoo has updated the link from,
http://ichart.finance.yahoo.com/table.csv? to http://real-chart.finance.yahoo.com/table.csv?
Also, there’s an issue with Excel2013 Querytables / BackgroundRefresh part. Yet to identify any solution to this. Have you encountered this at your end? Thanks in advance.
Thanks,
Ak
The spreadsheet still works for me with “http://ichart.finance.yahoo.com/table.csv?”.
I don’t have Excel 2013 so I can’t test the spreadsheet on that platform.
Hmm.. I changed the link to:
qurl = “URL;http://real-chart.finance.yahoo.com/table.csv?
and ran it in Excel2010, and it’s working now. But thanks anyway for checking!
Thanks, great stuff! Your script has made the complex task so easy..
Cool. Be sure to share investexcel.net with your friends! I need more visitors!
Thank you, Samir, for this excellent tool. It is a huge time saver.
Hi Samir,
Great work! Would it be possible to have the sheet names remain the same, instead of re-naming themselves to each ticker symbol?
Yes, it’s possible but it requires some reworking of the VBA. The current code relies on the renaming of the sheet names to the ticker symbols
Dear Samir,
thank you SO much! I am using the spreadsheet for my bachelor’s thesis and it is really helpful.
I have one question though: As I try to run the regression analysis, it shows me an error because of non-numerical data, as some of the cells seem to be imported as dates? Is there a way to change this by any chance?
Thanks for your help,
Ana
The ticker for Open Table (OPEN) causes a crash in the VBA code, just as the ticker for Lowes Corp (LOW) does, as Joe pointed out above. The creation of each respective tab would conflict with the existing Open-High-Low-Close naming convention already in place. Similarly, the potential tickers HIGH and CLOSE, if ever adopted by a company, would cause a similar issue with the VBA code as well.
Great work, Samir. Cheers!
Good points. I’ll add a suffix to the Open, High, Low, Close tabs (something like OpenPrices etc). That should work around the problem
I’ve renamed the Open and Low sheets to Open Price and Low Price (with similar changes for the other collated sheets).
There should be no conflict with the tickers OPEN and LOW
Download the updated spreadsheet for the fix.
The cvs file option does not work for me although the spreadsheet works fine
If i select the cvs option no files are written and i get —
error 9:
subscript out of range
The debug pop up shows
ErrorHandler:
Worksheets(“Parameters”).Select
Application.ScreenUpdating = True
Application.Calculation = xlCalculationAutomatic
I am using excel 2010 on windows 7
Works fine for me (on Windows 7, Excel 2010 and Excel 2013). I get the files written out
Works OK now.
Apparently the download folder ( c:\temp\ ) has t be created first.
Excellent Spreadsheet !
Thank you for the kind comment!
This is AWESOME! I modified it a bit to my personal preferences, and it works beautifully.
Thanks so much for sharing!
Samir,
your VBA development seems to be a “must” with so many happy users.
Before beginning could you confirm that ISIN codes will be recognized as well as tickers.
in France ISIN is the common pointer to OPCVM’s
in excel 2007 Stock Quotes are uploaded from MSN Money using ISIN lists via “MSN MoneyCentral Investor Stock Quote connection ( but smart tags do not seem to apply to isin codes only to tickers such as “MSFT”
Obviously i’m a full beginner.
RV
Dear Samir,
I just tested Multiple Stock Quote Downloader.xlsm under Excle 2003 &t did not work error 438
but under 2010 it works fine with the tickers demo list
I attempted my list of isin codes :
FR0000292278
LU0594300096
FR0010636399
LU0594300096
LU0048580855
LU0368678339
LU0099574567
FR0010923375
AAPL
but only the last code (ticker) was regognized.
However such data seem to be accessible i;e.
http://finance.yahoo.com/q/hp?s=FR0000292278.PA&a=03&b=29&c=2010&d=07&e=16&f=2014&g=d
Should i modify some settings?
Best & respect for your ergonomic design.
RV
In addition to formper comment :related to ISIN identification codes somth like
http://ichart.finance.yahoo.com/table.csv?s=FR0000292278.PA&a=03&b=29&c=2010&d=07&e=16&f=2014&g=d
seem to work & download a filled yahoo.csv Table
Date,Open,High,Low,Close,Volume,Adj Close
2014-08-01,18.12,18.12,18.12,18.12,000,18.12
2014-07-31,18.18,18.18,18.18,18.18,000,18.18
2014-07-30,18.46,18.46,18.46,18.46,000,18.46
………………………………………….
suggestion to modify the code ?
is it related to numerical values in the string
Maybe isin codes need to have a suffix indicating the quatation place
example:
FR0000292278.PA
Confirm ?
See my previous comment
For FR0000292278, I think you need to enter FR0000292278.PA
LU0594300096 isn’t recognized, either with or without the .PA suffix
FR0010636399 is recognized with the .PA suffix.
I haven’t tried the other ISIN codes.
The spreadsheet works fine for me on Excel 2010 and 2013.
I don’t have any experience with ISIN codes, so I can’t confirm whether they will or won’t be recognized
Mr Samir Khan,
I saw all your links in investexcel.net. Its very useful for share holders and I like those xls files. Actually I’m doing in Indian share markets nifty and other futures stocks in India market
Basically I want to determine the volatility of any particular stock in Indian market and use it in black scholes formula to find the value of option and check its variance from the original data.
Here is the link to take datas for all your queries.
http://www.nseindia.com/products/content/equities/equities/eq_security.htm
Can u create VB spreadsheet for that.
Can u help me out in that regards.
Hi samir,
I am trying to do a project for a finance class and I just started with VBA so I do not know a lot.
I saw your webpage on how to get stock quotes updated on an excel spread sheet and I would like to know what you did so the tickers you enter in the first page appear in the name of the files. Here is the code i think you use (but im not sure) I would like to understand so I can make my own thanks.
Sub CopyToCSV()
Dim MyPath As String
Dim MyFileName As String
dateFrom = Worksheets(“Parameters”).Range(“$b$5”)
dateTo = Worksheets(“Parameters”).Range(“$b$6”)
frequency = Worksheets(“Parameters”).Range(“$b$7”)
MyPath = Worksheets(“Parameters”).Range(“$b$8”)
For Each ws In Worksheets
If ws.Name “Parameters” And ws.Name “About” Then
ticker = ws.Name
MyFileName = ticker & ” ” & Format(dateFrom, “dd-mm-yyyy”) & ” – ” & Format(dateTo, “dd-mm-yyyy”) & ” ” & frequency
If Not Right(MyPath, 1) = “\” Then MyPath = MyPath & “\”
If Not Right(MyFileName, 4) = “.csv” Then MyFileName = MyFileName & “.csv”
Sheets(ticker).Copy
With ActiveWorkbook
.SaveAs Filename:= _
MyPath & MyFileName, _
FileFormat:=xlCSV, _
CreateBackup:=False
.Close False
End With
End If
Next
End Sub
Thanks for your time,
Julie
The ticker names appear in the file names because of this code
ticker = ws.Name
MyFileName = ticker & ” ” & Format(dateFrom, “dd-mm-yyyy”) & ” – ” & Format(dateTo, “dd-mm-yyyy”) & ” ” & frequency
Remember to tell your classmates about investexcel.net 🙂
Hi Samir,
Thank you very much for this downloader. It has saved me a bunch of time already! I am having an issue I was hoping you could help me with. I am mostly interested in the adjusted closing price worksheet. I input my ticker symbols on the parameters page, but only 4 of my rickets are being populated on the adjusting closing price worksheet. Each individual tab for all of the stocks are being created, I just can’t get them all to show on the adjusted sheet. Any ideas?
Thanks!
What are your tickers?
Hi Samir,
Great Work.
I am trying to use this downloader to analyse BSE stocks but unable to do so as its not fetching the data for the BSE tickers.
Can you please help
Regards
Abhishek
Hi Abhishek
It is working for me. You may give the ticker like WELSPUNIND.BO for BSE stocks and VOLTAS.NS for NSE stocks.
Vinod
Hi Samir,
Excellent Work.
I would like to download these data in rows for further analysis especially to use filters.
Is there any way to convert the downloaded data to another file other than using cut and paste with transpose option
Could you please help,
Vinod