This article describes how you can implement the Sharpe Ratio in Excel. As an alternative method, I’ll also give some VBA code that can also be used to calculate the Sharpe Ratio.
If you just want the spreadsheet, then click here, but read on if you want to understand its implementation.
The Sharpe Ratio is a commonly used benchmark that describes how well an investment uses risk to get return. Given several investment choices, the Sharpe Ratio can be used to quickly decide which one is a better use of your money. It’s equal to the effective return of an investment divided by its standard deviation (the latter quantity being a way to measure risk).
This is the Sharpe Ratio formula
There are several assumptions which can often mislead investors. The primary failing is that the math assumes the investment returns are normally distributed. This isn’t always the case – sometimes returns can be skewed or have other characteristics not described by the normal distribution
The math behind the Sharpe Ratio can be quite daunting, but the resulting calculations are simple, and surprisingly easy to implement in Excel. Let’s get started!
Steps to Calculate Sharpe Ratio in Excel
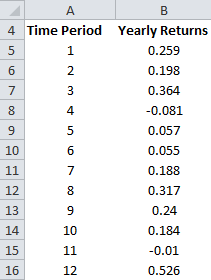
Step 1: First insert your mutual fund returns in a column. You can get this data from your investment provider, and can either be month-on-month, or year-on-year.
Step 2: Then in the next column, insert the risk-free return for each month or year. This is literally the return you would have got if you’d invested your money in a no-risk bank account (in case you need to, raise the yearly return to a power of 1/12 to convert it to a monthly return).

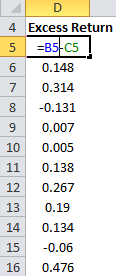
Step 3: Then in the next column, subtract the risk-free return from the actual return. This is your Excess Return
Step 3: Now calculate
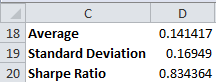
- the average of the Excess return. In the example above the formula would be =AVERAGE(D5:D16)
- the Standard Deviation of the Exess Return. For my example, the formula would be =STDEV(D5:D16)
- Finally calculate the Sharpe Ratio by dividing the average of the Exess Return by its Standard Deviation (in my example this would be =D18/D19)
VBA for the Sharpe Ratio
A cleaner solution is the following VBA function.
Function SharpeRatio(InvestReturn, RiskFree) As Double
 Dim AverageReturn As Double
 Dim StandardDev As Double
 Dim ExcessReturn() As Double
 Dim nValues As Integer
 nValues = InvestReturn.Rows.Count
 ReDim ExcessReturn(1 To nValues)
 For i = 1 To nValues
  ExcessReturn(i) = InvestReturn(i) - RiskFree(i)
 Next i
 AverageReturn = Application.WorksheetFunction.Average(ExcessReturn)
 StandardDev = Application.WorksheetFunction.StDev(ExcessReturn)
 SharpeRatio = AverageReturn / StandardDev
End Function
This function can be called by giving it two arguments; the first is the range containing the investment returns, while the second range contains the risk-free interest rates. For my example, the formula would be =SharpeRatio(B5:B16,C5:C16).
Download Excel Spreadsheet for the Sharpe Ratio
Thanks for upload this for excel user.
According my understanding, Standard deviation needs to be calculated of Portfolio Return instead of Excess return (as u did).
Please refer Investopedia or inform me if i am wrong
According to Wikipedia, the denominator is the standard deviation of the Excess Return (asset return – benchmark return).
So I think I’m right…
Uh… it’s equivalent?…
if the required rate of return is constant, then the standard deviations of both cases are the same.
Thanks for brief explanation. I does clarify a couple of things. What I do miss in your explanation are the the specific reason for your used assumptions. Why are you using the arithmetic average of the returns and not geomatric?
The building blocks of the Sharpe ratio—expected returns and volatilities—
are unknown quantities that must be estimated statistically and are, therefore, subject to estimation error.The question which Iam stuck at is wheter to use simple retruns (R1-R0)/R1 or LN (R1/R0). I know this has something to with normality, but what do think is better? And if I have computed the returns, which mean should I use..
Sorry to do this but your maths a little wrong.
To calculate the numerator work out the return for your investment first, this will mean geometrically linking (ie compounding) all of the 1 month returns. Averaging (as above) is incorrect. I then like to annualise this figure. Finally subtract the annualised risk free rate that has been realised over the period. One of the errors above is that you are meant to do the subtraction after the total return has been worked out (only doing one subtraction), not before as is the case on this web page.
Then work out the denominator. If you are using monthly returns this number will need to be adjusted. Just multiply it by the square root of 12 If your using quarterly data multiply by the square root of 4, ect. This adjustment was not done above.
Osama and Samir: You need to use standard deviation of returns not the standard deviation of excess returns (tracking error). You may be confusing the Sharpe ratio with the information ratio which is much more benchmark relative. Sharpe is more absolute.
Once again not trying to be nasty, sorry.
CFA charterholder, you’re wrong, sorry. Look at Sharpe’s 1994 paper (http://www.stanford.edu/~wfsharpe/art/sr/sr.htm), who actually designed the formula. He clearly uses the average, not the geometric, in the numerator. For both numerator and denominator, he also uses excess return, not actual.
Samir’s calculation follows exactly the ex-post definition of the Sharpe ratio defined in Wikipedia. Hence he has used a commonly accepted definition. I use the same definition.
samir is right cos he was working on yearly basis. he would have had to annualise the avg returns if he had monthly data
Very helpful – I am wanting to use the VBA across columns (not rows) so figured I would just change InvestReturn.Rows.Count to InvestReturn.Columns.Count but it doesn’t work for me (looked everywhere, tried all resources I have). Any ideas? Thanks.
Thanks for this, this really helped. All the other websites gave out formulas with no examples on application.
Ah, remember the good old days when risk-free rate was 5%? Now we can barely get 1%.
I have daily returns of three years. How should i calculate the Sharpe Ratio in that case.
To convert the annual return to a monthly return, raise the annual return to a power of 1/12. Huh? Since when? Somebody needs to brush up on their high-school algebra.
The correct conversion in Excel should be:
MPY=((((APY/100)+1)^(1/12))-1)*100
where MPY is Monthly Percentage Yield and APY is Annual Percentage Yield
Note, however, that this introduces a very small error in that it assumes a month is 1/12
of a year, whereas in reality none of the months are exactly 1/12 of a year.