This Excel spreadsheet will calculate the optimum investment weights in a portfolio of three stocks by maximizing the Sharpe Ratio of the portfolio.
This is known as the Sharpe Optimal Portfolio. Sample investment returns for the three stocks are provided, but the spreadsheet can be easily adapted to other stocks and a larger investment space.
It’s an easy spreadsheet to use, but click on the picture below for an overview of its structure and a set of instructions.
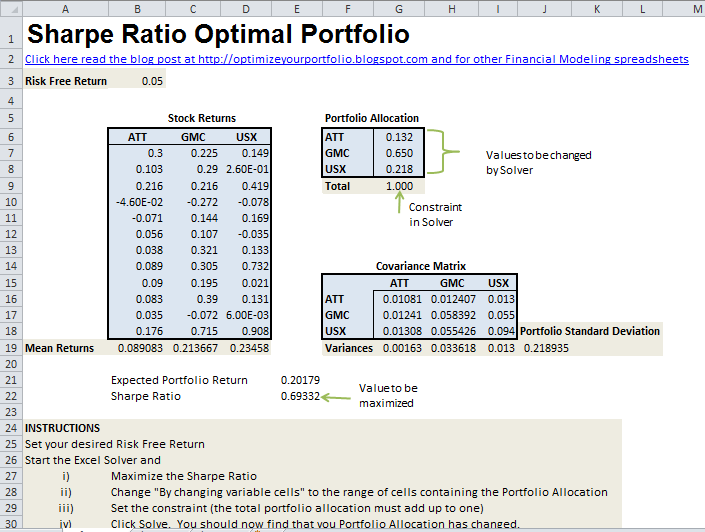
The spreadsheet uses the Excel Solver to find the portfolio that maximizes the Sharpe Ratio. You may need to enable the Solver Add-In by going to File>Options>Add-Ins>Manage.
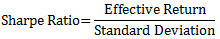
The Sharpe Ratio quantifies the risk efficiency of an investment. It’s equal to the effective return (the actual return minus the risk-free rate) of an investment divided by its standard deviation (the latter being a proxy for risk).
A high Sharpe Ratio signals an investment with greater risk efficiency and is desirable.
I’ve previously written about how you can calculate the Sharpe Ratio of a single investment. The process for a portfolio of several investments is more involved. You first need to calculate the covariance matrix for the portfolio. From the covariance matrix, you can calculate the total variance, and hence the standard deviation.
A Sharpe Optimal Portfolio effectively picks a portfolio on the intersection of the tangency line and the efficient frontier.
There are, however, several caveats which investors should be aware of when employing the Sharpe Ratio in gauging investment performance.
- The Sharpe Ratio should only be used to compare investment performance for positive values. This is because increasing volatility (i.e risk) for a negative Sharpe Ratio gives a higher ratio (in constrast to the general assumption that higher risk means a lower Sharpe Ratio)
- Risk is measured by the standard deviation of a portfolio. This is only valid if investment performance is normally distributed. This is not necessaily true for hedge funds or financial derivatives, which demonstrate skew and kurtosis.
- The risk-free rate of return is assumed to be constant over the investment horizon. This is not true – interest rates rise and fall all the time, so we use an average value
- And finally, the Sharpe Ratio is based on historical returns, and hence is backwards-looking. Investors should use the ratio in tandem with many other indicators to manage their portfolios.
Download Excel Spreadsheet to Calculate the Sharpe Ratio Optimal Portfolio
Could also calculate a Sharpe ratio of portfolio comprising real estate only (Office, retail, and Industrial).
I’m a student of Real Estate Management (M.Sc) and hence my interest.
Hi,
Can you help me making a spreadsheet that selects 3 ETF’s out of 15 each month on the basis of the optimal sharpe ratio?