Learn about the trading indicator that helped turned $100k into $1.1m in twelve months, and get a free automated Excel spreadsheet.
Traders who want a competitive edge make extensive use of trading signals. These include the Stochastic Oscillator, Average True Range, Relative Strength Indicator, and MACD.
Williams %R is one of the more popular, with a strong historical vintage. In fact, the creator, Larry Williams, turned $100k into over $1m over the course of a year, with a strategy based on this indicator, winning him the World Cup Championship of Futures Trading in 1987.
Just ten years later, his daughter Michelle Williams did the same!
Williams %R is very similar to the %K quantity in the Stochastic Oscillator, and is defined by this formula.
\(\% K = \frac{(H – C)} {(H – L)} \times -100\)
where
- C is the current closing price
- H is the highest high over the lookback period (usually 14 periods)
- L is the lowest low over the lookback period (usually 14 periods)
You can calculate Williams %R in Excel with a small alteration to the method described here.
Williams % is bounded between 0 and -100. Values lower than -20 and or higher than -80 signpost selling and buying triggers .respectively.
Larry Williams’ winning trading strategy amplified a $100k pot into $1.1 million in the space of 12 months. Briefly,
- he’d mark when William’s %R touched 0 (indicating overbought conditions)
- after five days, if Williams %R reached -15, he’d sell
He applied the opposite strategy if a security was oversold.
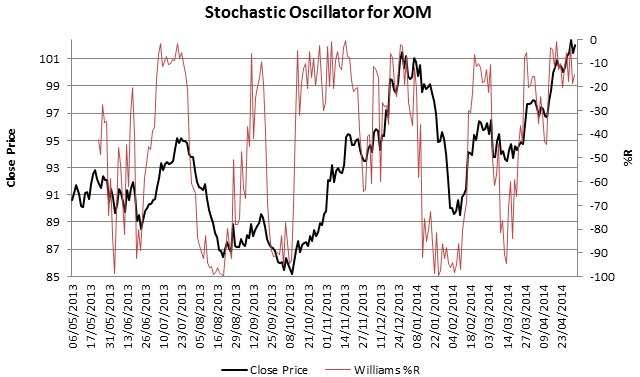
The chart above gives Williams %R and daily closing price for Exxon Mobile (XOM) between 4th May 2013 and 4th May 2014. As you can see, the trading indicator bounces between 0 and -100. Examine the chart carefully – you can certainly see how this trend-following indicator can be used to develop a solid trading strategy. For example,
- Williams %R dipped below -90 in January 2014 (as the closing price fell). This meant Exxon Mobil was oversold, giving you a buying signal
- The closing price then rose over February and March 2014

This Excel spreadsheet automatically calculates Williams %R from historical stock quotes automatically downloaded from the internet. You can even pick your lookback period. Simply enter a ticker symbol, two dates and click a button.
With some modifications to the spreadsheet (by hacking around in VBA), you can even automatically generate buying and selling triggers.
Download Spreadsheet to Automatically Calculate Williams %R from Data from Yahoo
Price for your Williams %R for Excel spreadsheet download?
Thanks!
The spreadsheet is a free download (click the “Download Spreadsheet to Automatically Calculate Williams %R from Yahoo” link).
If you want to view the VBA, then make a donation and I’ll send you an unlocked sheet.
I am interested in the VB Code “….. Download Yahoo Williams% R”, tell me how to make the donation and its cost.
Greetings
There’s a Donate button on the top-right of InvestExcel.net. Just click that and donate $10 via PayPal.
Hey Samir, I am reviewing your work with the Excel spreadsheets and data retrieval and analysis. Having trouble opening the Williams %R spreadsheet – It states ” Compile error in hidden module: Module1″
I am running a 2003 Microsoft Office package and each time I get the above error message.
I also did download and successfully use your 2002 Microsoft Excel version of the GetData (from Yahoo) file and that worked fine? Any ideas to run the Williams %R spreadsheet? Thank you for your assistance.
Looking forward to trying this. In the meantime, might you have an Excel version that works similarly to this, but calculates Williams’ Accumulation Distribution formula that he devised in the 70s?
https://investexcel.net/accumulation-distribution-line/
The Accumulation/Distribution Line spreadsheet to which you’ve pointed indicates it is based upon Marc Chaikin’s work. Chaikin basically believed that if a stock closed in the upper half of its trading range and volume was strong the stock was being accumulated and if closing in the lower half of its range, it was being distributed. Williams’ AD formula was (is) focused on the volume as an indication of accumulation or distribution by professional investors. He basically compared the stock’s closing price with the opening price then added or subtracted volume (using a cumulative look from the prior day) based on the degree to which the stock closed above or below its open. This follows what the volume-moving investor is doing. He originally published this is ’69 and re-released his book about it in about 1984. It’s a tad unnecessarily repetitive but clearly presented: I can send you a copy saved to PDF, if you like. Anyway, that’s the Excel spreadsheet I am after.
I do like that these spreadsheets of yours amass the data on one tab and using those figures, generate a chart on another tab. Having a workbook doing this with Williams’ original formula would be pretty awesome.
A point of clarification: Williams original AD Formula is principally concerned with the a stock’s volume divergence from the broad market, which thus signals to buy or stay out (or go short). In other words, Based on volume, the accumulation or distribution of a stock against the broad market IS the divergence and THAT is the actual signal. Thought it best it illuminate this fact.
OK, send me the PDF and I’ll see if I can work it up into a spreadsheet
Thank you. This past weekend I e-mailed links on Williams AD: They explain the Oscillator and Williams’ own improvements (that he calls, “The Ultimate Oscillator”). Presumably the core calculations remain the same as explained in the PDF (at PDF pages 38 and 40-42). I’ll e-mail the PDF today. Again, thank you for looking into this.
Samir, thank you for creating this site and posting these spreadsheets. This is a wealth of information! After playing around with the Williams %R workbook, I was wondering if you have any versions of the workbook which allow a user to analyze the %R for multiple tickers simultaneously? Also curious if you’ve updated the spreadsheet per your previous conversion with Tolleson?
Thanks!
Hello Samir,
Could you modify your VBA code so it can download multiple stocks and calculate Williams of each? If so, I’m interested to donate and get the source code. Please let me know if such modification is feasible to you.
Thanks,
Elson
Yes, I can do this. I just need time.