Discover how to calculate the stochastic oscillator in Excel, and get a web-connected spreadsheet that automatically plots this critical technical indicator.
The link to the free automated spreadsheet with connectivity to Yahoo Finance is at the bottom of this article, but read on to discover more about the stochastic oscillator.
George C. Lane, in an intellectual epiphany, developed the stochastic oscillator in the late 50s. This important technical indicator calculates the momentum of stock price changes, and is defined by these equations (courtesy of Wikipedia).
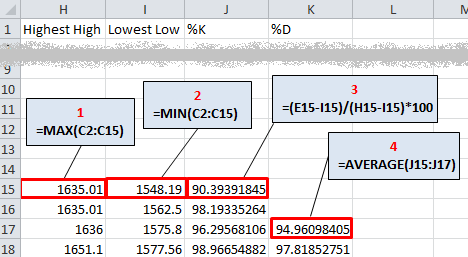
\(\% K = \frac{(C – L)} {(H – L)} \times 100\)
where
- C is the current closing price
- H is the highest high over the lookback period
- L is the lowest low over the lookback period
%K is plotted with another quantity, %D. %D is a simple moving average of %K over a defined smoothing period. The lookback period is usually 14 days and the smoothing period is usually 3 days . %K and %D always range between 0 and 100.
Three variants are commonly employed by technical traders
- The fast stochastic is described by the equations above
- The slow stochastic: %K is a three-period moving average of the fast %K, with %D being an n-period moving average of the fast %K
- The full stochastic: %K is an n-period moving average of the fast %K, with %D being an n-period moving average of the the full %K
If a security trends upwards day-by-day, then it generally closes near the upper limit of its daily trading range; the stochastic oscillator will rise. However, if the security falls, then then daily closes will be at or near the lower limit of their daily trading range; the stochastic oscillator will then fall.
Trading Signals
If the stochastic oscillator
- rises above 80, signs point to an overbought stock; prices could well fall in the near future
- falls below 20, signs point to an oversold stock; prices could very well bounce upwards
If %K
- rises above %D, that’s a buying signal (unless the values are greater than 80)
- falls lower than %D, that’s a selling signal
- rises above 90 or 95 and then falls, you’ll probably want to sell before %K falls below 80.
A divergence happens when the stochastic oscillator (typically the %D line) and the stock price move in opposite directions; this means the general trend is losing its strength, and could very well reverse.
- if the stock price trends downwards and makes lower lows, but the stochastic oscillator does not fall further than its prior lows, that’s a bullish divergence
- if the stock price trends upwards and makes higher highs, but the stochastic oscillator does not rise further than its prior highs, that’s a bearish divergence
The divergence signals are amplified if %D is above 80 or below 20.
The stochastic oscillator is often paired with MACD; these two technical indicators work well together.
Calculation
The stochastic oscillator is easy to calculate in Excel. You can use worksheet formulas (this is simpler but less flexible) or VBA (this requires more specialist knowledge but it far more flexible).
This is how you calculate the stochastic oscillator using worksheet formulas
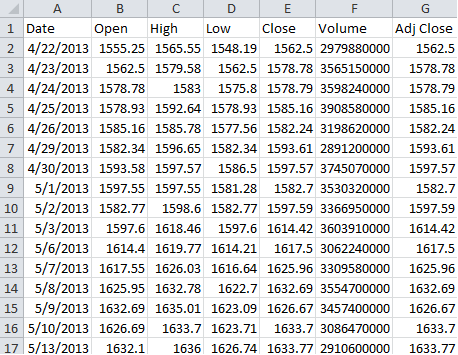
Step 1. Get OHLC data for your stock. You could use the ever-popular Bulk Stock Quote Downloader (if you do, remember to copy the downloaded data into a new spreadsheet – otherwise your formulas get deleted when you updated the sheet).
Your data may look like this
Step 2. Assuming that the lookback period for %K is 14 and the smoothing period for %D is 3, enter the worksheet formulas as illustrated below.
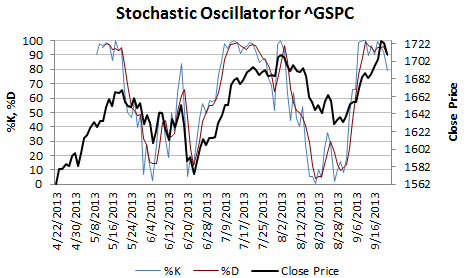
Step 3. You can now plot %K, %D and the close price using Excel’s charting tools.
Plot the Stochastic Oscillator Automatically For Any Stock or Index!
This Excel spreadsheet automates the calculation of this technical indicator for any ticker found on Yahoo Finance. After you
- enter two dates.
- a ticker symbol,
- your lookback and smoothing period
- and click a button,
some clever VBA connects to Yahoo, downloads historical OHLC data, and performs the calculations.

The chart in the picture plots this technical indicator for the S&P500 (^GSPC). %K and %D bounce between 10 and 90, moving with the stock price; This generates relatively reliable trading signals.
Get the spreadsheet at the link below.
Hi Sir,
I have tried to plot stochastic oscilator by copying into my own excel, everything is working but close price line is missing as well not updating on the right side. please tell me how can i overcome this problem
Hi Samir,
the formula on this page is not correct. (%K=(C–H)(H–L) ×100)
It must be %K=(C–L)(H–L) ×100 -> (C-L) instead of (C-H)
In the spreadsheet the correct formula is used.
Thank you – I’ll correct the formula in the article
Samir:
I’m getting VBA error on querying data 43. I’m trying to use Apache OpenOffice on my ASUS notebook PC. o perhaps the problem is OpenOffice but I do have macros enabled. Your Excel program looks very useful, so I hope I can use it on OpenOffice.
Thanks
I’m not sure if it will work in OpenOffice (don’t know if that understands VBA). I’ve only ever used the spreadsheet on Excel 2010 or 2013 on Windows.
Shouldn’t equation 2 in your spreadsheet be =MIN(D2:D15) instead of =MIN(C2:C15)?