Learn how to annualize daily, weekly and monthly volatilities. Plus get free web-connected spreadsheets to calculate the historic volatility of stocks, precious metals and currency pairs.
Historical volatility is regularly calculated from daily returns.
But you often need to convert daily volatility to other time horizons so that you can make a fair comparison.
This is simple to do. You multiply by the square root of the time scaling factor. For example, to convert
- daily volatility to annual volatility, multiply by the square root of the number days in a year. That is, σannual = σdaily √(252).
- daily volatility to weekly volatility, multiply by the square root of the number of days in a week. That is, σweekly = σdaily √5, assuming 5 trading days in a week
- 1-day volatility to an n-day volatility, multiply by √n
Why the Square-Root Rule for the Time-Scaling of Volatility?
There’s a simple reason. Assuming rMsub>1, r2…rN are a sequence of N log returns, then the variance is given by the following equation.
![]() Hence, since the standard deviation (or volatility) is square root of the variance, then.
Hence, since the standard deviation (or volatility) is square root of the variance, then.
![]()
This method of scaling volatility is only appropriate if
- returns are independently and identically distributed
- prices are log normally distributed (that is, their behavior is governed by geometrical brownian motion)
- volatility is calculated from log stock prices
However, daily (or high frequency) stock prices are generally not independently and identically distributed. In this case Diebold et al. (1998) shows that scaling volatility to a longer time horizon can amplify fluctuations in the data; scaled volatilities are often overestimated.
Spreadsheets to Calculate Volatility
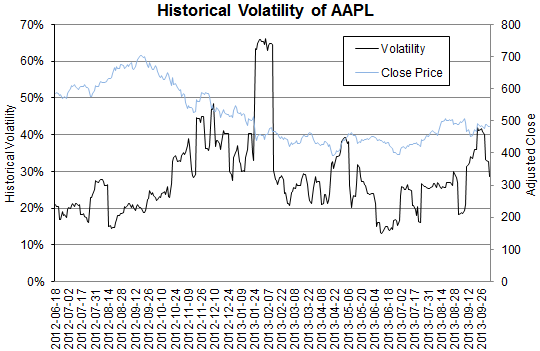
These articles offer Internet-connected Excel spreadsheets that calculate the historical volatility of
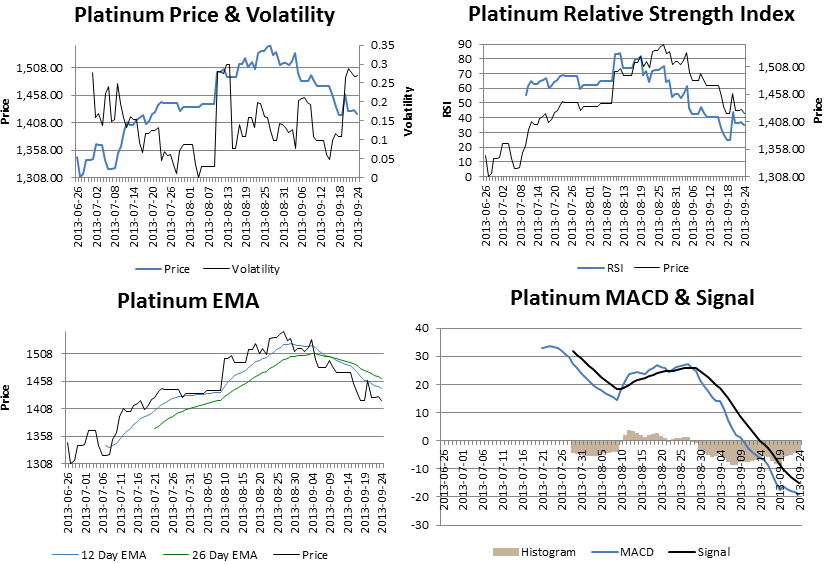
You also get the average true range, relative strength indicator, MACD and EMA.
All price data is downloaded automatically from the Internet. Volatility is calculated from daily price data, but rescaled to a year (you can change the number of trading days in a years).
Hi,
i refer to your article on multiple stocks data fetching.
I am unable to get BSE sectoral indices values, can you look into it.
Thanks.
Howdy, I do believe your website might be
having internet browser compatibility problems. Whenever I look at your site in Safari, it
looks fine however when opening in IE, it has some overlapping issues.
I just wanted to provide you with a quick heads up!
Other than that, great site!