This is a simple but remarkably insightful method of valuing stocks.
Financial analysts used a variety of approaches to find the intrinsic value of shares.
The Gordon Growth Model, for example, is a subset of a larger group of models known as Dividend Discount Models. The model states that the value of a stock is the expected future sum of all of the dividends.
If the predicted value is higher than the actual trading price, then the share is priced fairly.
While the Gordon Growth Model is named after Myron J Gordon, analysts have employed this technique (and variants thereof) since the early 20th century.
In this article, we derive the key valuation formula, and find the intrinsic value of Exxon Mobil using the latest market data.,
Deriving the Core Formula
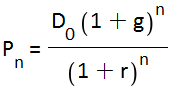
If the current value of the dividend is D0, then assuming a constant dividend growth rate of g, the dividend in year n will be
![]() Assuming we require a compound rate of return of r, the present value of the dividend in year n is
Assuming we require a compound rate of return of r, the present value of the dividend in year n is
 Adding the present value of all the dividends from year n back to the present day, we reach a total present value of
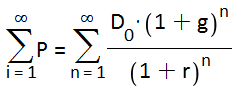
 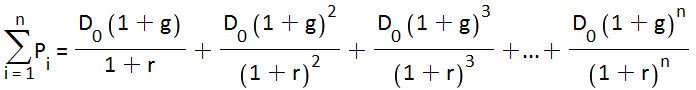 Projecting this equation to n= infinity gives us the following infinite sum.
 This is a geometric series that gives a remarkably simple formula for the intrinsic value of a stock
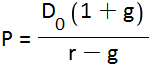 If the expected dividend in year 1 is D1, then the equation can be further simplified to

Required Rate of Return
The Capital Asset Pricing Model is often used to estimate r. The formula is
![]() where
where
- rf is the risk-free rate
- rm is the market risk premium
- β is the stock beta relative to a benchmark
Assumptions
- The Gordon Growth Model lets you strip away any and all current market factors to give you an estimate of the intrinsic value of a company. However, by only capturing the effect of dividends, the model excludes all other factors – such as branding or a unique product
- The model assumes that a company pays dividends (however, variants of the model route around this assumption by estimating what the dividend would be if it were paid).
- The required rate of return must be larger than the expected dividend growth rate (otherwise, the intrinsic value would be negative.
- The dividend growth rate must be estimated. This is speculative and risky , especially given the fact the intrinsic value can vary widely given small changes in the dividend growth rate.
- The dividend growth rate is assumed to be constant in perpetuity.
- The valuation is very sensitive to the difference between the required rate of return and the dividend growth rate. A small change in the difference can lead to a very different valuation.
Gordon Growth Model in Excel
This Excel spreadsheet helps you value a company using the Gordon Growth Model, using the CAPM approach for the required rate of return.

It’s already populated with the data for Exxon Mobil.
- 30-year dividend growth rate: 0.064
- 3-year beta vs S&P 500: 1.15
- Risk-free rate of 0.0235 (daily Treasury long term rate on 14 April 2015)
- Market risk premium of 0.1
- Total dividends paid out of 2.7 per share in 2014
This results in a valuation of 60.5. The closing price on 15th April 2015 is, however, 88.08. This means that the Gordon Growth Model predicts that shares of Exxon Mobile are currently overpriced.
Download Excel Spreadsheet to Value Stocks with the Gordon Growth Model
Doesn’t work on Mac. Can you fix it?
No. I haven’t got the slightest idea why it doesn’t work on your mac