Plot the Commodity Channel Index for any stock by entering a few parameters and clicking a button.
Donald Lambert introduced CCI in his book “Commodities Channel Index: Tools for Trading Cyclical Trends”. Pretty much as the title says, CCI helps you filter out noise, revealing cyclical trends in price action.
Explore this popular technical indicator with the Excel spreadsheet that comes with this article. The VBA can be viewed, dissected, modified and altered.
CCI balances the the current price relative to the average price over a lookback period. If CCI is high, the stock is overbought. However, if CCI is low, the stock in undersold.
CCI is simple to calculate – you only need the high, low and close price for a stock. Here are the equations
 The 0.015 in the formula attempts to restrict the majority of the movement of CCI to the range -100 to +100.
This chart gives the CCI for Caterpillar (CAT).
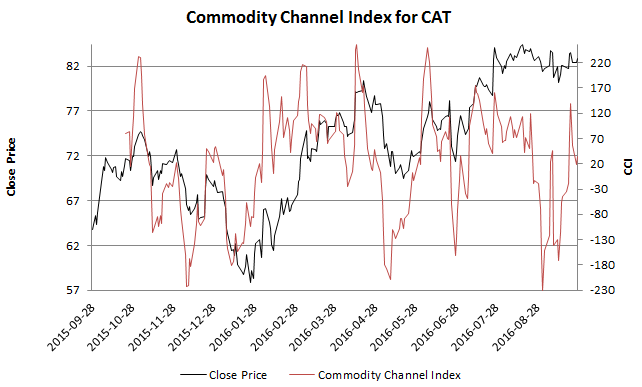 This chart was automatically by the free Excel spreadsheet accompanying this article.
Identify Trends, and Oversold/Overbought Levels
Sharp moves outside the range -100 to +100 indicate the potential emergence of a new trend.
Typically, a buy signal is indicated when CCI rises above +100 (with a sell signal when the CCI falls back below +100). The reverse is true if CCI falls below -100 (with a buy signal when the CCI rises back above -100).
Effect of Lookback Period
The n-day moving average and the mean deviation (and hence the indicator) is strongly influenced by the chosen lookback period.
A smaller lookback period
- introduces more volatility into the indicator.
- encourages the indicator to move outside -100 to +100
- is used to identify long term trends
A larger lookback period
- smooths out the indicator
- discourages the indicator to move outside -100 to +100
Decision Support Tool
Chartists typically use Commodity Channel Index with other indicators, such On Balance Volume or MACD.
Spreadsheet to Generate Commodity Channel Index Charts
This Excel spreadsheets will calculate the Commodity Channel Index for any stock, using data downloaded from Yahoo Finance. The computation is automated in VBA – you can examine, modify and learn from the code.
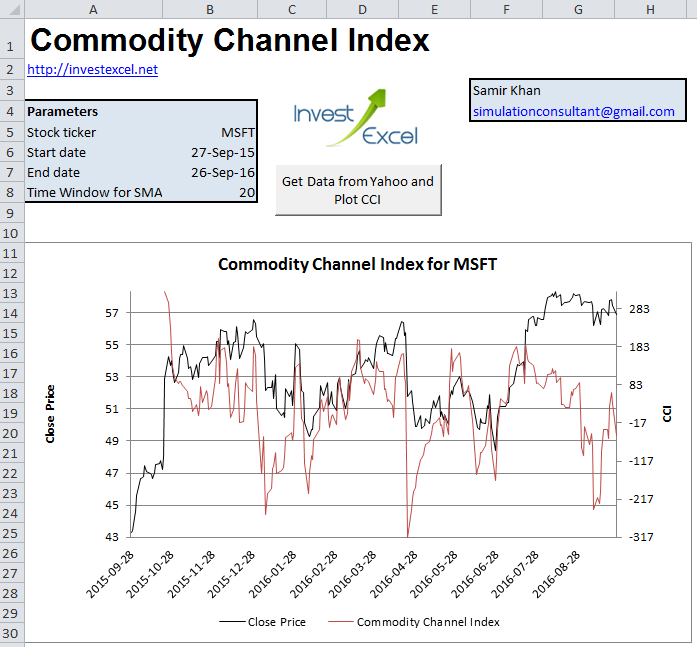 You can also change the time frame over which the moving average and mean deviation is calculated.
Here’s the part of the VBA that calculates the CCI (the rest is in the spreadsheet). The code assumes that high, low and close prices are entered into columns C, D and E of sheet dataSheet.
'CCI Calculation timeWindow = parameterSheet.Range("timeWindow").Value meanDeviationFormula = "=(" For i = 0 To timeWindow - 1 meanDeviationFormula = meanDeviationFormula & "ABS(RC[-1]-R[-" & i & "]C[-2])" If i < timeWindow - 1 Then meanDeviationFormula = meanDeviationFormula & "+" End If If i = timeWindow - 1 Then meanDeviationFormula = meanDeviationFormula & ")/" & timeWindow End If Next dataSheet.Range("G1") = "Typical Price" dataSheet.Range("G2:G" & nRows).FormulaR1C1 = "=(RC[-4] + RC[-3] + RC[-2])/3" dataSheet.Range("H1") = timeWindow & "-Day SMA of TP" dataSheet.Range("H" & timeWindow + 1 & ":H" & nRows).FormulaR1C1 = "=AVERAGE(RC[-1]:R[-" & timeWindow - 1 & "]C[-1])" dataSheet.Range("I1") = timeWindow & "-Day Mean Deviation" dataSheet.Range("I" & timeWindow + 1 & ":I" & nRows).FormulaR1C1 = meanDeviationFormula dataSheet.Range("J1") = timeWindow & "-Day CCI" dataSheet.Range("J" & timeWindow + 1 & ":J" & nRows).FormulaR1C1 = "=(RC[-3]-RC[-2])/(0.015*RC[-1])" |
Note that the formula for the mean deviation is
- programmatically constructed inside a For loop as a string.
- and entered into the spreadsheet using the FormulaR1C1 format
Other approaches could have been chosen, but this method was used to highlight formulas can be programmatically constructed.
Excel Spreadsheet to Generate Commodity Channel Index
Hi Samir
Wanted to take a look at the new spreadsheet on MSFT. But data retrieved from Yahoo are no good.
Data Open High Low Close
2016-09-26 57.080.002 57.139.999 56.830.002 56.900.002
2016-09-27 56.93 58.060.001 56.68 57.950.001
2016-09-28 57.880.001 58.060.001 57.669.998 58.029.999
2016-09-29 57.810.001 58.169.998 57.209.999 57.400.002
2016-09-30 57.57 57.77 57.34 57.599.998
I suggest implementing a check in the VBA that compares new price to old price and determines the factor between to and then adjusts onwards. But if the first price received is wrong then you are toasted anyways. This is bad Yahoo.
Thanks for your fine work.