Get a free open-code Excel spreadsheet to chart the Chaikin Oscillator, with historical market data downloaded from the web.
The spreadsheet also calculates on-balance volume and the accumulation-distribution line. Scroll to the bottom of this post for the download link, but read on to discover more about Marc Chaikin’s tool for uncovering hidden pricing pressure.
Large investment funds – like hedge or mutual funds – employ analysts that investigate a company for its fundamental value, often also meeting the company directors.
Accordingly, the fund may buy a significant number of shares, thus increasing the trading volume; the share price will then gradually increase as the market prices in the demand. However, if many sell-orders are placed, the share price may trend downwards.

Trading volume for a specific stock is often publicly available. Yahoo Finance, for example, provides free historical daily trading volume for a number of exchanges worldwide. Google Finance offers free trading intraday trading volume for the preceding 15 days. A greater range of intraday trading volume and prices can be purchased from other sources.
Technical traders often study trading-volume based indicators to discover where the large players are placing their money.
Marc Chaikin developed the Chaikin Oscillator (together with the accumulation distribution line) in the 1970s to help traders uncover pricing pressure that’s bubbling under the surface. The formula is
Chaikin Oscillator = 3-day EMA of ADL – 10-day EMA of ADL
The oscillator has a datum of zero, and the size of the moving averages can be changed to reveal different scales of price action. The steps needed to calculate ADL are given here.
Briefly, if the Chaikin Oscillator is
- positive, hidden buying strength may cause prices to rise
- negative, hidden selling pressure may cause prices to fall
As you might notice, the formula is similar to that used to calculate MACD, the key difference being
- MACD predicts changes in price momentum
- Chaikin Oscillator predicts changes in momentum of the flow of money into or out of a stock.
Bear in mind that the Chaikin Oscillator is separated from the price and trading volume by three degrees. For example, this is the chain of calculation: price and volume -> close-location value and money flow volume -> accumulation-distribution line -> Chaikin Oscillator

This Excel spreadsheet charts the Chaikin oscillator, as well as the accumulation-distribution line and on-balance volume. Similar to the many other free spreadsheets on this site, the spreadsheet connects to Yahoo Finance to download historical market data.
Enter a ticker symbol, and a start & end date, and click a button. VBA does the heavy-lifting; there are subroutines for
- downloading OHLCV data from Yahoo,
- generating the cell-based formula to calculate the indicators,
- deleting the existing charts,
- and creating new charts

You can also change the time-window of the moving averages to explore hidden pricing pressure at different scales.
The VBA code is not locked away with a password – it’s exposed and viewable.
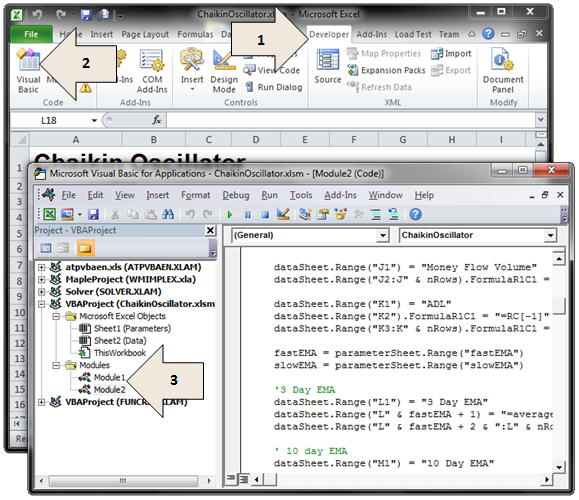 Accessing the Visual Basic takes just a few steps; just select the Developer tab, click Visual Basic and select either Module1 or Module2.
Download Spreadsheet to Connect to Yahoo Finance and Plot Chaikin Oscillator – Full VBA