Learn how to calculate on-balance volume with Excel. This technical indicator employs volume flow to gauge where the smart money is going.
Get a free web-connected spreadsheet from the link at the bottom of this post, or read on to learn how it is calculated with VBA.
Indicators like RSI, ATR or MACD lag behind prices – they describe price action that has already occurred.
However, on-balance volume (OBV) is different – its aim is to lead price movements by detecting hidden buying or selling pressure.
First presented in the 1963 book Granville’s New Key to Stock Market Profits, OBV is just a running total of trading volume.
- If close price of day n > close price of day n-1, then OBV of day n = OBV of day n-1 + trading volume
- If close price of day n < close price of day n-1, then OBV of day n = OBV of day n-1 – trading volume
- If close price of day n = close price of day n-1, then OBV of day n = OBV of day n-1
This, for example is a plot of OBV for Exxon Mobil for the year from October 2013.
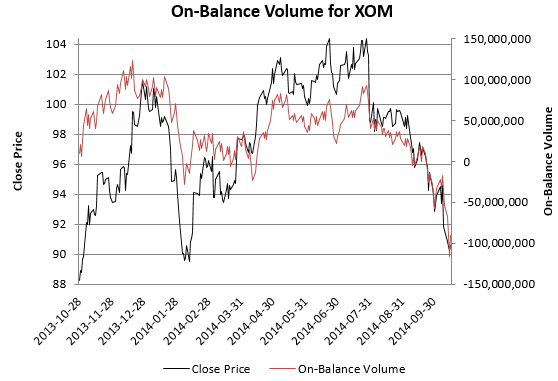
If a price follows the market trend, then OBV will move up or down with the price. However, if price and OBV diverge, then a price reversal may be looming. Since OBV leads price, a divergence means investors have to be vigilant.
Calculating OBV is simple – you just need historical close prices and trading volume, Excel and a touch of motivation.
First acquire your historical market data (including the trading volume) – use the bulk stock quote downloader to quickly download prices. Then code up the algorithm above. You only need two nested IF() statements.
Assuming your historical prices are in column E, trading volume in column F (both in data ascending order), and you want OBV in columm H, then
- the OBV of day 1 is the trading volume of day 1
- the OBV of day 2 is given by the formula =IF(E3 = E2, H2, IF(E3 > E2, H2 + F3, H2 – F3 ))
- the OBV of day 3 is given by the formula =IF(E4 =E3, H3, IF(E4 > E3, H3 + F4, H3 – F4 ))
- and so on
An illustration is given below.

If you’re familiar with VBA, you can write a macro that automatically generates these equations for the entire range of dates. Examine the code snippet below.
dataSheet.Range("H2").FormulaR1C1 = "= RC[-2]" dataSheet.Range("H3:H" & nRows).FormulaR1C1 = _ "=IF(RC[-3] = R[-1]C[-3], R[-1]C, IF(RC[-3] > R[-1]C[-3], R[-1]C[0] + RC[-2], R[-1]C[0] - RC[-2] ))" |
In this code, we fill column H (from row 2 to row nRows on sheet dataSheet) with the formulas that calculate OBV. The formulas are in R1C1 format.

This web-connected Excel spreadsheet will plot OBV for any ticker from Yahoo Finance. Simply
- type in two dates
- enter a ticker
- and click a button
VBA provides the engine that powers the worksheet; the code connects to Yahoo Finance to download historical market data, automatically insert the formula required to calculation OBV into the spreadsheet, and generate a plot. Feel free to view and learn from the code.
Click Here to Get the Spreadsheet
Great work, Just wondering where In excel can I see where the data is being drawn from. I am trying to learn the code myself and understand how this process works.
Appreciate where your doing here,
– Mike
Look in the VBA editor
Thanks for all your great work. It’s very educational. Unfortunately while it says “feel free to view and learn from the code”, the spreadsheet is password protected. Any chance of getting the password or a spreadsheet that’s not protected?
My mistake. I’ve just uploaded a new version with no password
Which button do I click in order to get the information to change to the new ticker?
The spreadsheet has only one button titled “Get Data from Yahoo and Plot On-Balance Volume”. Click that.
Thank you for this! Is it possible to save the size and style of the displayed chart differently? Everytime I enter a new ticker, the size and style always reverts back to the earliest one, which I find to be hard on my eyes.
You need to change the plot style in the VBA. Otherwise it will always choose the look-and-feel I coded into the VB
How we can find divergence
is it like for E.g If price has fallen down change in price % is 4.2% and change in OBV % is -3044%
then in this case price will fall down am I right
And one more question what is the minimum % for change in price and change in OBV for divergence